PostgreSQL Top queries
Published 08 March 2023
SQL Monitor uses the pg_stat_statements view to sample data from the PostgreSQL instance.
Queries which ran within the selected focus window, and have the most significant metrics, are displayed in the Top Queries table.
The maximum number of rows displayed can be altered (defaults to 10 rows) by the control on the right.
The metrics other than Execution count can be shown as either Average per execution or Total across the focus window.
Each row can be clicked to show an expanded Query Details View.
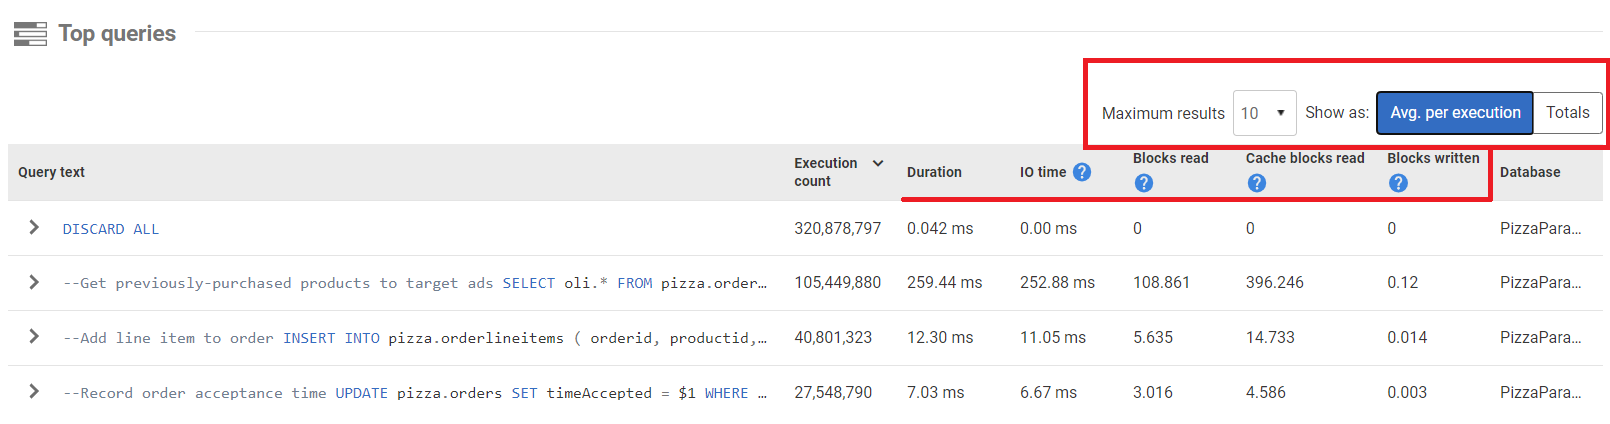
The top queries table shows:
Execution count - the number of occurrences of this query within the selected focus window.
- Duration - the time taken for this query.
IO time - the amount of time in milliseconds spent reading or writing blocks from the filesystem. This is the sum of
blk_read_timeandblk_write_time.- Blocks read - the number of blocks read that were requested from the Operating System because they weren't available in shared buffers. This is the sum of
shared_blks_read,local_blks_readandtemp_blks_read. - Cache blocks read - the number of blocks read from the buffer cache. This is typically the fastest way blocks can be read. This is the sum of
shared_blks_hitandlocal_blks_hit. - Blocks written - the number of blocks written. This is the sum of
shared_blks_written,local_blks_writtenandtemp_blks_written. - Database - the database against which this query was run, and these metrics sampled.
Query Details View
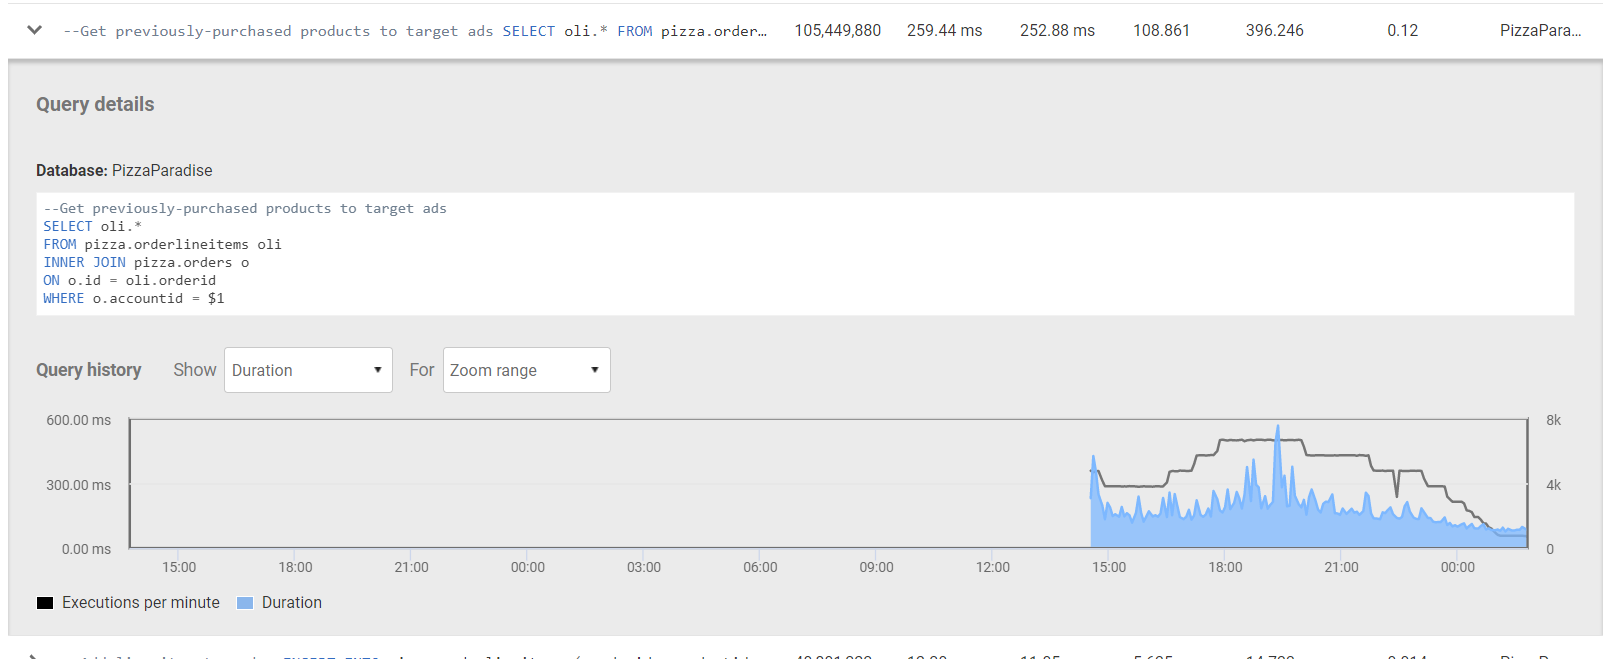
Selecting a row in the Top Queries table opens, or closes, a more detailed view of the query.
The full Query Text is shown along with a Query History graph shows the detail of how a selected metric has varied over time.
You can select which metric to show ('Duration' is shown in the image below), as well as the timespan over which to show it. By switching between the different metrics and observing the change in the graph, you can get insights into how the instance is behaving with this query - whether read and write times have suddenly increased (perhaps indicating a problem with I/O), if the cache hit rate has dropped (perhaps indicating memory pressure, with more data kept on disk), or generally if the duration has suddenly increased.
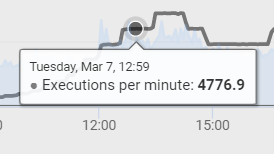
Hovering over either line on the graph will show the specific value at that point.
Viewing query plans
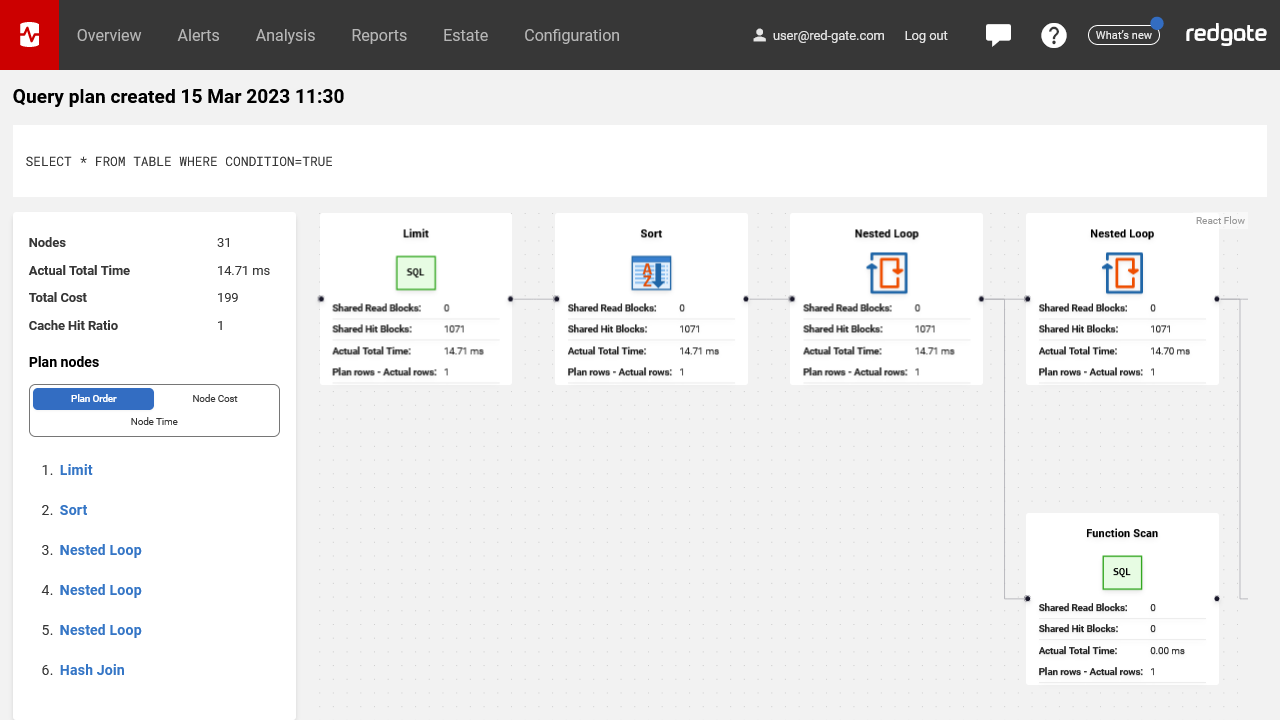
Depending on your instance's auto_explain configuration, SQL Monitor may have been able to sample a query plan for some or all of your top queries. If a query plan is available to view, additional buttons will be available to access it. Click 'view query plan' to view the plan in a modal pane, or click 'view plan in new tab' to access it in a new tab with a permanent link.

The query plan is displayed as a graph. Each box represents a PostgreSQL plan node, and lines between nodes indicate which nodes depend on which. You can select nodes to view their specific properties in more detail; either click on the node in the graph, or locate it in the left hand pane using one of the available sort orders and click on it there. You can use this view to identify which plan nodes are most responsible for the query's duration - perhaps a scan is being run instead of the expected seek.
This documentation contains proprietary information and is protected by copyright law.
Copyright © 2026 Red Gate Software Limited. All rights reserved


