Replication
Published 04 September 2023
SQL Monitor supports the monitoring and display of physical streaming replication for PostgreSQL clusters. Introduced in version 13.0.15.
The PostgreSQL Instance Overview page displays a populated Replication section if SQL Monitor detects either incoming or outgoing physical streaming replication for the instance.
Role
A replication role will be shown for the instance.
- Primary if this instance is sending its WAL to other instances (and not receiving WAL from elsewhere)
- Secondary if this instance is receiving WAL from another instance (and not sending)
- Cascading if this instance is both sending its WAL and receiving from elsewhere
The role gives some context for the charts and settings shown in the Replication section.
Settings
Some replication-related PostgreSQL configuration settings are displayed in the bar next to the role.
- max_wal_size is a soft-limit on the WAL size. Unless units are specified, will be in megabytes.
- max_replication_slots limits the replication slots on a server, or number of replication origins on a logically-replicating subscriber.
- wal_keep_size is the minimum size of log files to keep in case a streaming replication client requests them. Unless units are specified, will be in megabytes and will default to 0.
- max_connections is a limit on all connections to the server (not just replication). For standby (receiving) servers this should be at least as high as for the primary.
Incoming replication
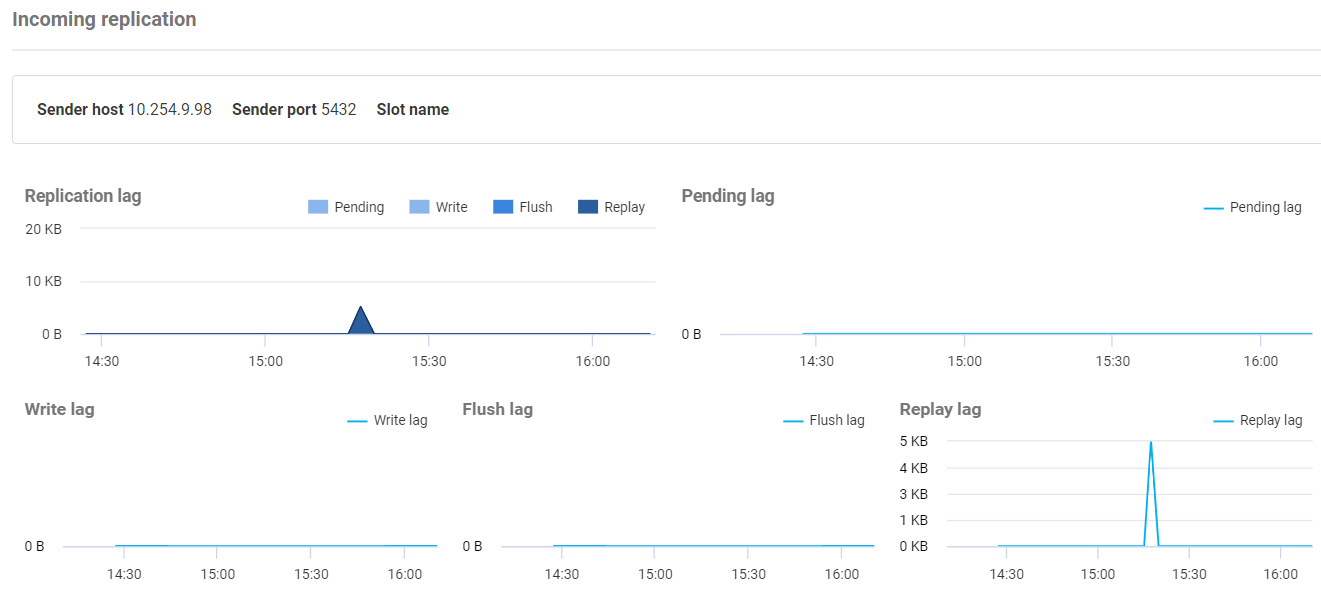
This section will be shown for either a Secondary or Cascading instance, which is receiving a WAL file from another instance.
Sender host details are shown (as seen from the receiving instance, sampled from pg_stat_wal_receiver).
Replication lag, broken down into Pending, Write, Flush and Replay is shown charted over time, as sampled from pg_stat_replication.
Outgoing replication
This section will be displayed for either a Primary or Cascading instance, which is sending its WAL file to another instance.
The actual WAL size is shown charted against the sampled max_wal_size setting. Replication lag for each of the receiving replicas is charted.
Replica nodes and replication slots
These sections will be displayed for either a Primary or Cascading instance.
Replica nodes shown are those instances directly receiving the WAL file from this instance (not every node in the cluster).
The Address column shows the replica's address as seen by the sending instance.
The Monitored column indicates whether this node is being monitored by SQL Monitor.
If the max_slot_wal_keep_size setting is left at the default value (-1 meaning unlimited), it will be highlighted here.


