Configuring alerts
Published 03 December 2012
SQL Monitor provides sensible factory defaults for alert types so that alerts can be raised as soon as you've installed the application. You can use the Alert settings page (Configuration > Alert settings) to customize individual alert types for specific jobs, disks, databases, servers, clusters and groups.
If you want to be alerted to issues that are not already covered by the alert types provided in SQL Monitor, create a custom metric to collect this data and add a custom alert. For more information, see Creating custom metrics and alerts.
How are alert settings applied?
Alert settings are applied in a hierarchy; an object inherits its alert settings from the level above in the hierarchy. For example, a database inherits its settings from the instance, which in turn inherits settings from the host machine, which inherits from the group to which it belongs.
When you first add a server to monitor, it inherits default alert settings for every type of alert from the All Servers level, which is the highest level in the hierarchy.
What can be configured?
For each type of alert, you can:
- disable it, so the alert will not be raised in future
- change the level at which it is raised, to either Low, Medium, or High
- change the thresholds that raise an alert (certain alert types only)
- change the email recipient
Each type of alert can be customized for each object you are monitoring (for example, a specific server, job, or database). You can also customize alerts across groups of objects (all databases on an instance, all servers in a group), or change everything at once using the All Servers setting.
To set up and configure global email notification settings, see Setting up email notification.
Configuring alert settings
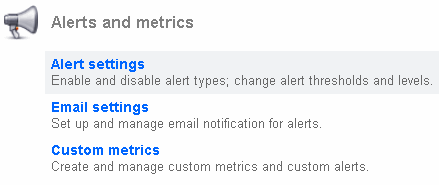
Go to the Configuration tab. Under Alerts and metrics, select Alert settings:
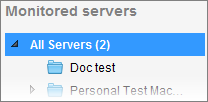
To configure an alert type for a group, host machine, SQL Server instance, database or job, drill down to select the required object from the Monitored servers list. The alert types relevant for the selected object are listed. For example, if you select a database, only the six database-specific alert types are displayed.
Click on the alert type in the list that you want to edit and follow the instructions in Customizing settings below.
Changing the default alert settings (the All Servers level)
By default, when you first go to the Alert settings page, you are at the All Servers level. Changing the settings at the All Servers level applies the settings to everything you're monitoring:
Click on the alert type in the list that you want to edit.
Click Restore defaults to reset an alert type back to its factory settings.
Configuring the settings for a raised alert
When you click Configure alert... for a raised alert (from the Alert Inbox or from an individual alert page), SQL Monitor takes you straight to the alert configuration settings page for that object.
For example, configuring an Integrity check overdue alert will take you to the alert settings page for the specific database for which the alert was raised:
On the alert settings page, the page title and hyperlinked breadcrumbs beneath identify exactly what settings are displayed:
In the example above, the alert settings page is for the AdventureWorks database on the sql2005 instance only. If you edit the settings at this level, you will be changing the alert for just that database.
To edit this alert so that it applies to a broader scope of objects, click on the appropriate higher level in the breadcrumbs. For example, to edit the settings for all databases in the "Workstations" group:
The page title is updated to reflect the fact that you are editing the alert settings for a group.
Customizing settings
The level from which the selected object currently inherits its settings for this alert type is displayed at the top of the page. The rest of the configuration options are grayed out.
Select Customize settings for this level to configure this alert type for the current level and all levels beneath. Once selected, the other options on this page become available. After you have customized a particular level, this level will not inherit subsequent changes made to the levels above, including changes applied at the All Servers level.
Disabling an alert
Every alert type (except Processor under-utilization) is enabled by default for all servers when you first install SQL Monitor. This should ensure that you're aware of any potential problems with your servers.
Select Disabled to stop raising alerts of the current type for the selected object. This will prevent any future occurrences of this type of alert appearing in the Alert Inbox when the conditions that would have triggered this alert are encountered. The rest of the configuration options on the page are grayed out.
Click Apply changes near the bottom of the page. The alert is grayed out in the Alert settings page and the Enabled column displays a disabled icon:
If you disable an alert type when there are currently Active alerts of that type, these alerts are automatically updated to Ended when SQL Monitor next polls your servers.
Setting alert levels
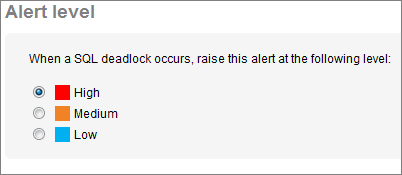
All alert types can be raised at either Low, Medium or High, depending on how critical they are to your systems. You can change this level to suit your priority levels.
For example, if a SQL deadlock occurs, by default the Deadlock alert is raised as a High alert because in most cases, a DBA would treat this as priority and want to investigate it immediately. For some servers, however, you may want to drop the level to Medium or Low, so that you can filter them out when viewing your most critical High level alerts.
Setting alert thresholds
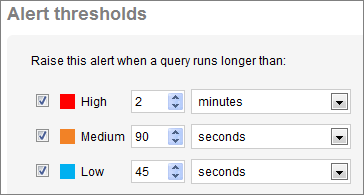
Some types of alerts have multiple thresholds that you can match to Low, Medium or High level. The alert is raised when it passes the lowest-defined threshold, and can then escalate to a higher level when it passes another threshold. You do not have to enable all these levels.
In the example below, the Long-running query alert is configured to be raised as a Low alert after 45 seconds, be automatically escalated to a Medium alert after 90 seconds, and then to High after 2 minutes. When the query finally ends it will be marked as Ended.
In the Alert Inbox, the alert level will change automatically as the different thresholds are passed. This allows you quickly to keep track of how serious this problem is, and prioritize queries for investigation that have escalated to High.
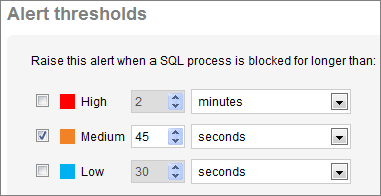
In the example below, only the Medium level has been enabled for the Blocked process alert. In this case, no alert will be raised until the block lasts for at least 45 seconds, and the alert will be raised as Medium. It will remain as a Medium alert however much longer the block lasts. When SQL Monitor detects that the block is over, the alert is marked as Ended.
You can see that the thresholds are multiples of 15 seconds in both examples. SQL Monitor only collects data about most problems on your servers every 15 seconds.
Configuring email notification
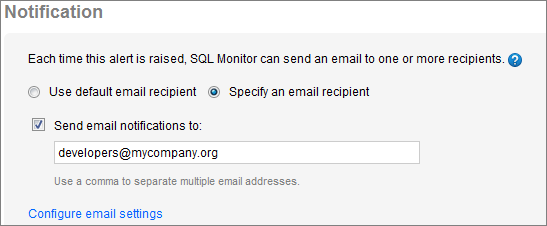
Until you set up your mail server settings in SQL Monitor, no emails will be sent regardless of the settings you apply on any Alert settings page. Click Configure email settings to enable email notification across the application. See Setting up email notification.
There are two options for sending email notifications:
- Use default email recipient
Sends email notifications for this alert to the email address entered in the Send emails to box on the Email settings page. If you edit the global email address on the Email settings page, then this alert will automatically pick up the new global setting. - Specify an email recipient
Customize email notifications for this alert:To disable emails for this alert, clear the Send email notifications to box.
To send emails for this alert to one or more recipients, type the email addresses you want in the box.
Configuring multiple alerts
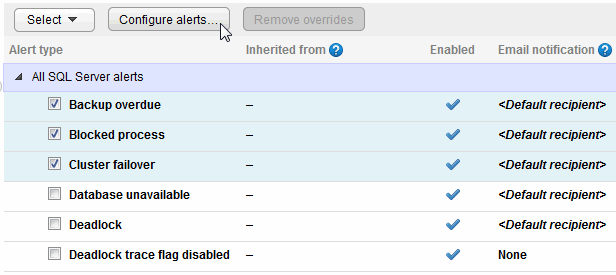
To configure multiple alert types simultaneously, select them using the check boxes or the Select drop-down list, and click Configure alerts:
For multiple alert types, you can only configure whether all the selected alerts are enabled or disabled, and apply email notification properties. Configurable thresholds either don't exist or vary greatly for certain alert types, so these changes must be carried out on an individual basis.
Configuring alert settings for individual disks
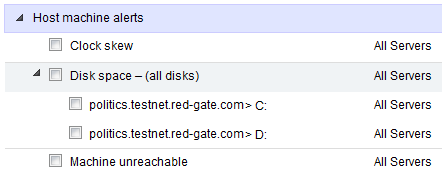
For the Disk space alert, you can configure alert settings for individual drives on your machine. Click on the arrow before the alert to display the drives, and select individual or multiple drives for configuration:
Finding customized alerts
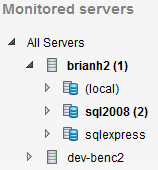
You can see which alerts have been customized at which levels in the Monitored servers list; they are indicated by the number in brackets:
In the above example, one alert has been customized at the machine level, and two at the SQL Server instance level. When you select a level in the Monitored servers list, those alerts that have been customized at the selected level are identified by <This level> and highlighted in bold:
