Global Overview
Published 28 October 2013
The Global Overview is the default front page for SQL Monitor. It presents a high-level summary of the health of all your servers, showing which servers have uncleared alerts raised against them, and what their current CPU and memory usage is. Servers that require attention are color-coded. From the Global Overview, you can quickly decide which server to investigate in more detail.
Following links from the Global Overview
- Click on any object (server or database) in the Monitored servers list to view the overview page for that object.
- Click on a group to filter the Global Overview to show only servers in the selected group.
- Click on the name of a host machine or SQL Server instance in the Servers column to go to the Overview page for that server. You can also click in the Status column.
- Click on a number in the alerts summary panel at the top of the page to go to the Alert Inbox pre-filtered by your selection (e.g. High or Unread) across all servers.

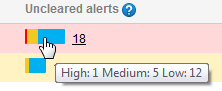
- Click on the colored bar chart under Uncleared alerts to go to the Alert Inbox to view alerts for that host machine or SQL Server instance:
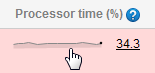
- Click on a sparkline graph in the Processor time or Memory Used column to go the Analysis page for those metrics: