Using the Alert Inbox
Published 08 July 2015
The Alert Inbox is an email-style inbox for all the alerts that SQL Monitor has raised. Like an email inbox, you can browse through the list, open a particular alert, mark it as read, or select multiple alerts at a time.
- The Alert Inbox updates automatically to check for new alerts every 30 seconds. You do not need to manually refresh your browser.
- By default all the alerts are pre-configured with sensible default values.
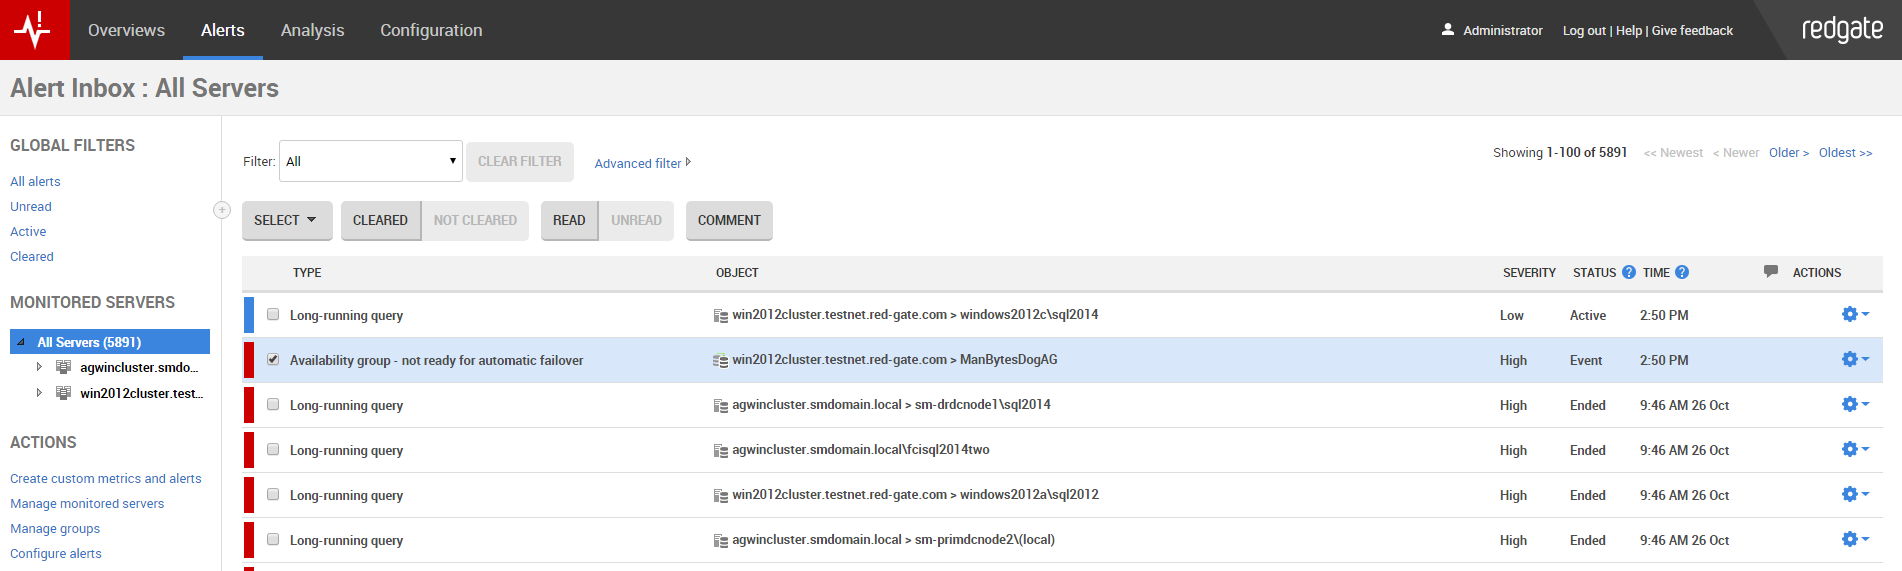
The status of each alert is shown in the Status column:
Seeing more alerts
When you first install SQL Monitor, the Alert Inbox shows a maximum of ten alerts per page.
- To view the next ten alerts, click Older.
- To view the last page of alerts, click Oldest.

- To increase the number of alerts shown, use the Rows to display option below the inbox:

Viewing alerts for a particular object
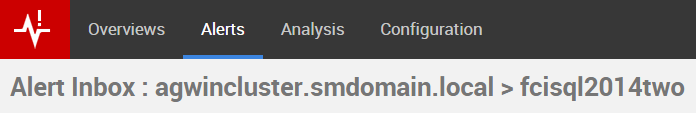
When you first click the Alerts tab, SQL Monitor always shows every uncleared alert across all your servers. Under Monitored servers, click on a group, host machine, SQL Server instance, or database. The Alert Inbox page title reflects the currently selected object:
To change the list of alerts displayed, continue to drill down in the Monitored servers list. Alerts are shown for the currently selected level and all levels below. If you select a host machine, for example, you will see:
- alerts raised for the machine itself (such as disk space or memory alerts)
- alerts raised for all instances running on it (such as job failed or error log entries)
- alerts raised for all databases on those instances (such as fragmented indexes or backup overdue alerts)
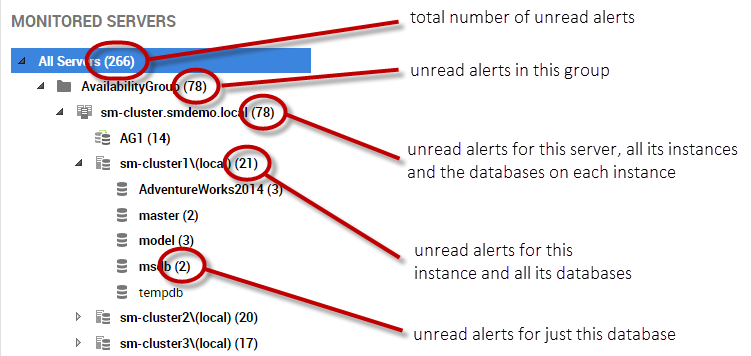
The number in brackets after an object in the Monitored servers list always shows the number of unread alerts, regardless of the current filters applied. As you drill down in the hierarchy, the number of unread alerts at each level is displayed:
The list of alerts is also filtered by whatever is set in the Filter drop-down.
How alerts are sorted in the Inbox
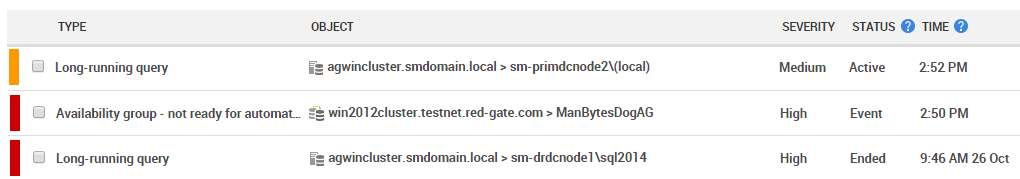
Alerts are sorted by the time they were raised, or for continuous alerts, whenever they changed level or were updated to Ended.
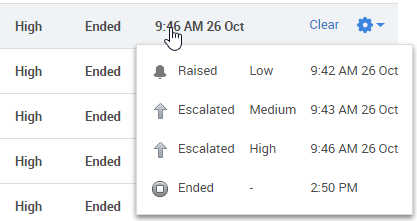
An alert's timestamp is not updated when:
- An alert changes to Ended
- An alert is cleared
- An alert downgrades to a lower level
- An alert escalates to a level that it has already previous reached
Actions you can apply to alerts
To: | Do any of the following: |
Open an alert, in order to view its details on a separate page | Click anywhere in the row for the alert. Click Open from the Actions list |
| Open an alert in a new tab | Right-click on the alert and select Open in new tab. Click Open in new tab from the Actions list |
Mark an alert as read (only available for alerts that are currently unread) | Right-click on the alert and select Mark as read. Click Mark as read from the Actions list Select the alert using its checkbox: then click the Read button:
This is useful when selecting multiple alerts to mark as read. Open the alert: alert is automatically marked as read. Clear the alert: alert is automatically marked as read. |
Mark an alert as unread (only available for alerts that are currently read) | Right-click on the alert and select Mark as unread. Click Mark as unread from the Actions list Select the alert using its checkbox then click the Unread button. This is useful when selecting multiple alerts to mark as unread. |
Clear an alert (Cleared alerts are hidden from the inbox by default) | Right-click on the alert and select Clear. Click Clear in the alert row:
Click Clear from the Actions list Select the alert using its checkbox then click the Cleared button. This is useful when clearing multiple alerts. |
Add a comment | Right-click on the alert and select Add comment. Click Add comment from the Actions list Open the alert and select the Comments tab, then use the Add comment button. Select the alert using its checkbox then click the Comment button. You can add a comment to multiple selected alerts. Comments are displayed in the Alert Inbox. Only the most recent comment for each alert is available. To display a comment, hold the mouse pointer over the Comments icon |
Select one or more alerts | Select the checkbox |
Configure an alert | Right-click on the alert and select Configure. Click Configure from the Actions list Under Actions on the left side, click the Configure alerts link to go to the Alert settings main page, where you can adjust the settings for any alert at any level. See Customizing alerts. |


Selecting alerts
Selecting alerts is a useful way to apply actions to multiple alerts at once, rather than having to perform the action for each alert in turn.
Turn on the checkbox  next to each alert you want to select. Use Shift + click to select a block of alerts.
Selected alerts are highlighted in the inbox by row color.
Applying actions to selected alerts
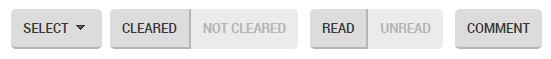
Use the command bar above the Alert Inbox to apply actions to all the currently selected alerts:
- If you select Add Comment, the same comment will be added to all the selected alerts.
- Clearing or reading a selection of alerts may remove them from the Alert Inbox, depending on the current filter settings.
Inline commands and actions from the Actions drop-down menu are only ever applied to the single alert.
Using the Select button
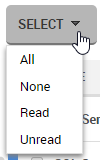
Use the Select drop-down button to select large groups of alerts at once:
The Select option only applies to the current filtered view of your alerts. For example, if you are currently filtering the Alert Inbox to show only Medium Job failed alerts, and choose Read, then only Medium Job failed alerts that are marked as read are selected.
The Select drop-down list is context sensitive. If you are currently filtering the Alert Inbox to view only unread alerts, the Unread option will not be available.
Selecting alerts across multiple pages
When there are several pages of alerts, only the current page of alerts is selected by default. You can choose to apply the selection to all alerts on all pages:

If you choose this option, the message is updated:
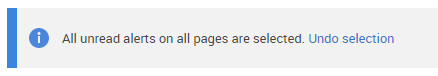
Use the Older and Newer links to confirm that alerts are selected on other pages. Clicking Undo selection will undo the selection on all pages except the page where you first applied the selection.
Any actions you apply at this point, for example Mark as read, Clear, or Add comment will be applied to all selected alerts on all pages.
Filtering alerts
You can filter which alerts appear in the Inbox by any of their attributes:
- by level (Low, Medium, High)
- by status (Event, Active, Ended, Cleared)
- by type (e.g. Job failed, Backup overdue, or any selection)
- by action taken (Read, Unread, Commented, No Comment)
- by time
SQL Monitor has built-in filters for the most common options you may want. You can also create your own filters using the Advanced filter pane.
See Filtering alerts.
This documentation contains proprietary information and is protected by copyright law.
Copyright © 2026 Red Gate Software Limited. All rights reserved


