Overview pages
Published 08 July 2015
The overview pages in SQL Monitor show the health of your monitored servers at various levels. They're refreshed automatically every 30 seconds, so you don't need to refresh your browser.
The global dashboard is the default front page for SQL Monitor, but there are also overviews for clusters, availability groups, host machines, SQL Server instances, and databases.
The overviews are useful for analyzing server performance and diagnosing problems.
Understanding the overview tables
All the overviews have one or more tables showing status and alert information for your monitored servers, and some overviews also show performance data.
You can analyze server performance by clicking various parts of the tables.
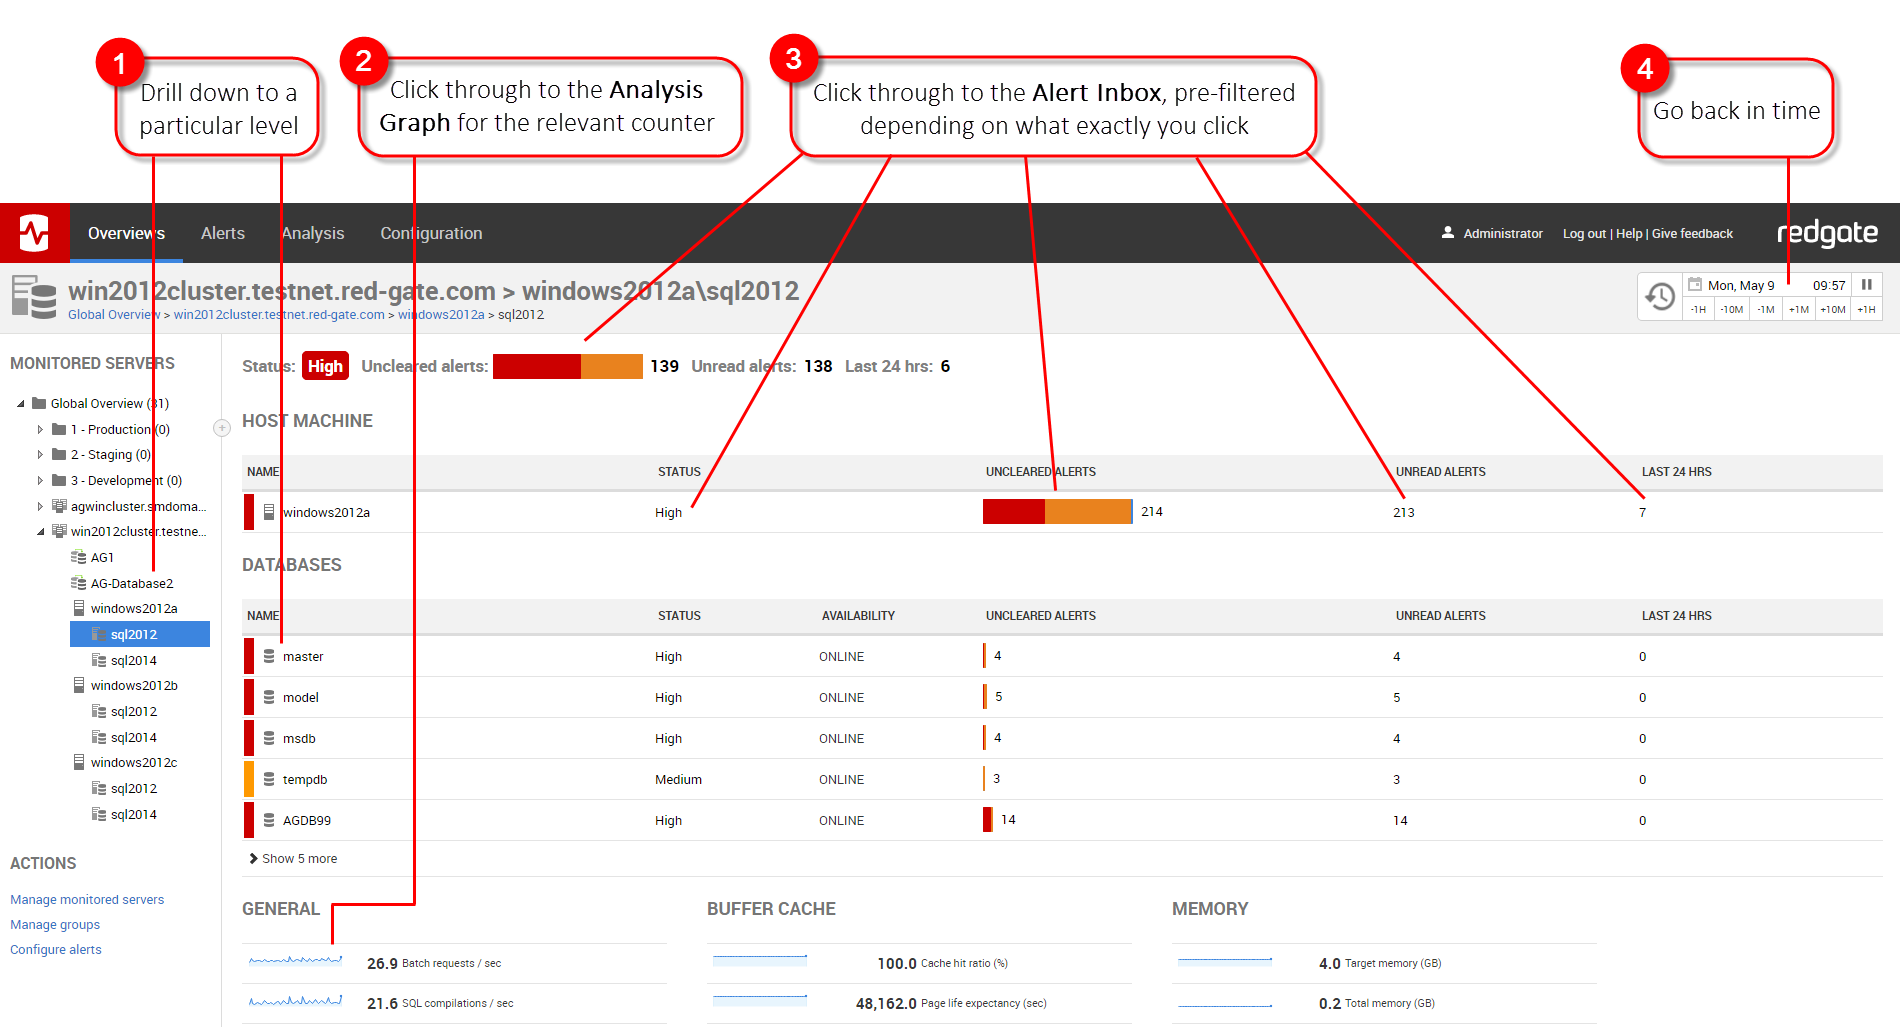
(1) Drill down to a lower level
Drill down either from the Monitored servers list on the left of the screen, or by clicking one of the hyperlinks under Servers in the table.
(2) Click through to the Analysis Graph
You'll reach the Analysis Graph for the relevant counter and object.
(3) Click through to the Alert Inbox
The inbox will be filtered according to exactly what you click on. For example, if you click Last 24 hrs, the inbox will be filtered to show only the alerts raised in the previous 24 hours.
(4) Go back in time
Use the Back in Time feature to see the state of your data at some point in the past.
Understanding the additional information on each overview screen
All overviews have additional information below the tables, such as performance data and performance diagnostics.
Cluster overview
The cluster overview shows all nodes in the cluster, and the SQL Server instances running on the cluster.
It also shows:
- information about which resource groups the various resources (including SQL Server instances) are allocated to
The resources are various entities that are capable of being managed by a cluster. A resource can only be owned by one node at a time. If the resources section is empty, see the troubleshooting page Resources section is empty.
A resource group is a collection of resources that are managed as a single unit (e.g. the SQL Server group). During a failover, the groups is moved from one node to another node.
For more information, see Cluster fundamentals (MSDN article).
Availability group overview
The availability group overview shows the primary replica and its databases, and all availability replicas and their databases.
It also shows:
- alerts, statuses, and failover information for availability replicas
- metrics for the databases
See Availability group overview for more details.
Host machine overview
The host machine overview is similar to the cluster overview. You can see the status for the machine itself, view all its monitored SQL Server instances, and follow links to the Alert Inbox.
It also shows:
- performance data
top 10 system processes
Processor time % and memory usage graphs are not available for individual system processes on the Analysis page.
SQL Server instance overview
The SQL Server instance overview lists all the databases hosted on the instance and shows the status of each.
It also shows:
- performance data
performance diagnostics (top waits, top queries, SQL user processes, SQL Server error log)
Performance diagnostics are not available for servers running Microsoft SQL Server 2000.
Database overview
The database overview shows information about the database, its general properties, its data and log file sizes and locations, and backups.
It also shows:
- performance data (including the most recent backup of each type)
performance diagnostics (top queries)
Performance diagnostics are not available for servers running Microsoft SQL Server 2000.
This documentation contains proprietary information and is protected by copyright law.
Copyright © 2026 Red Gate Software Limited. All rights reserved


