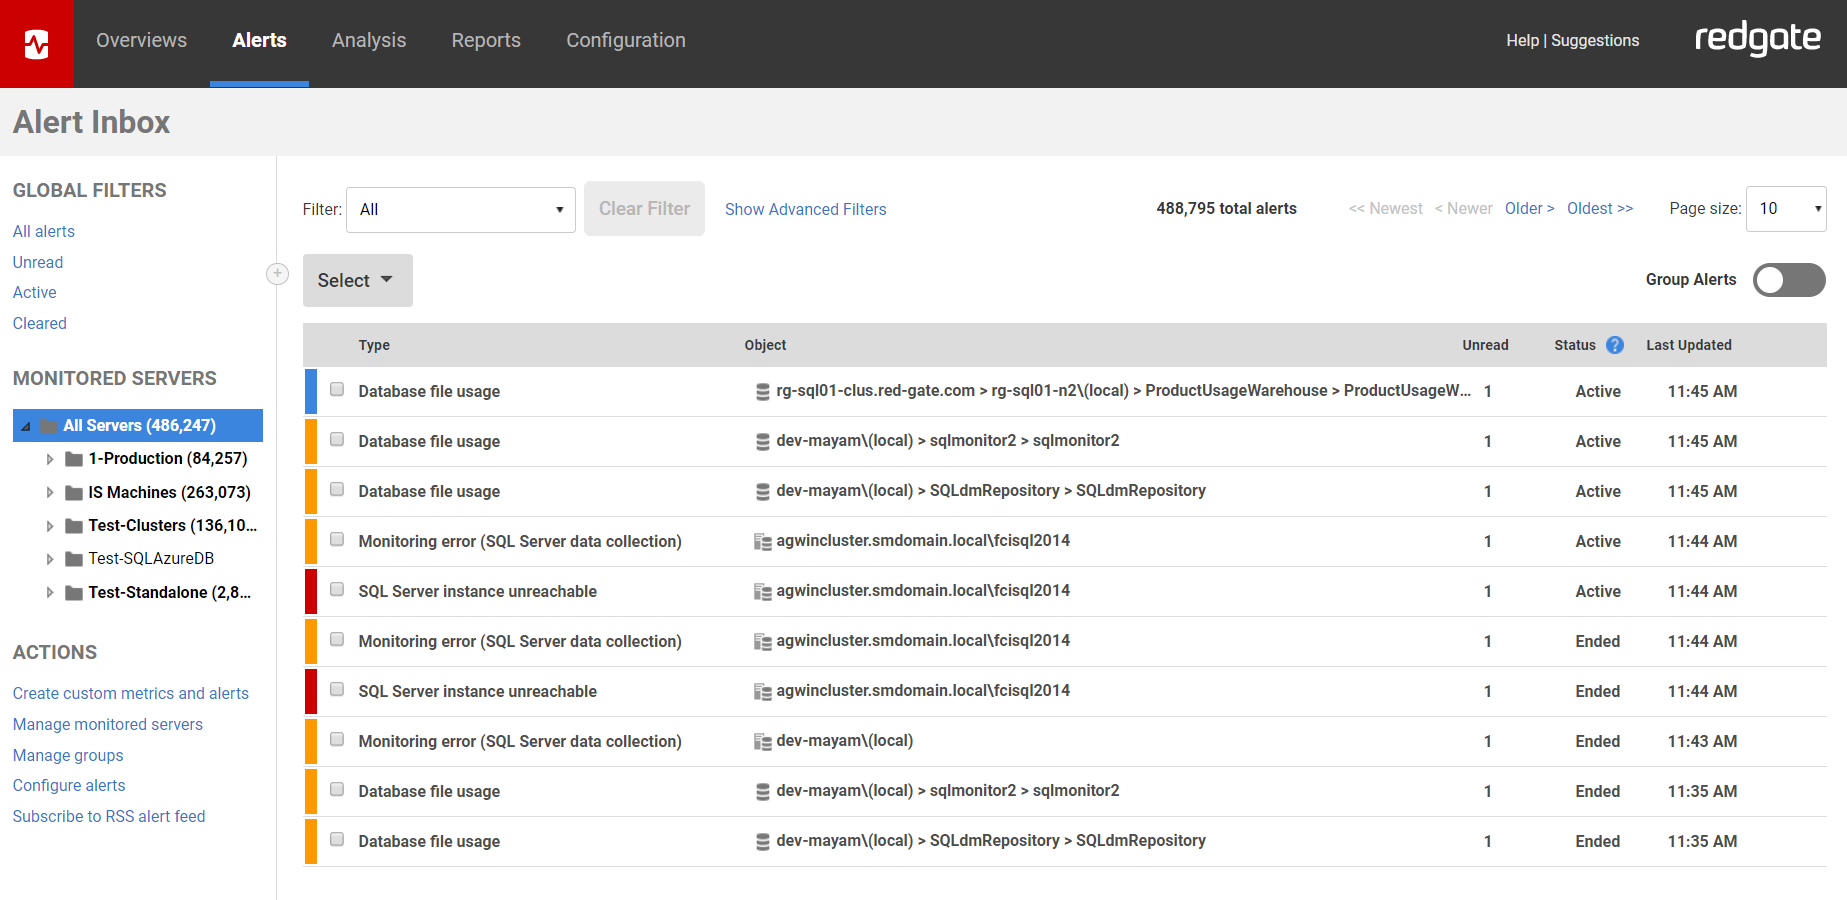
Using the Alert Inbox
Published 08 March 2018
The Alert Inbox is an email-style inbox for all the alerts that SQL Monitor has raised. Like an email inbox, you can browse through the list, open a particular alert, mark it as read, or select multiple alerts at a time.
The Alert Inbox updates automatically to check for new alerts every 2 minutes. You do not need to manually refresh your browser.
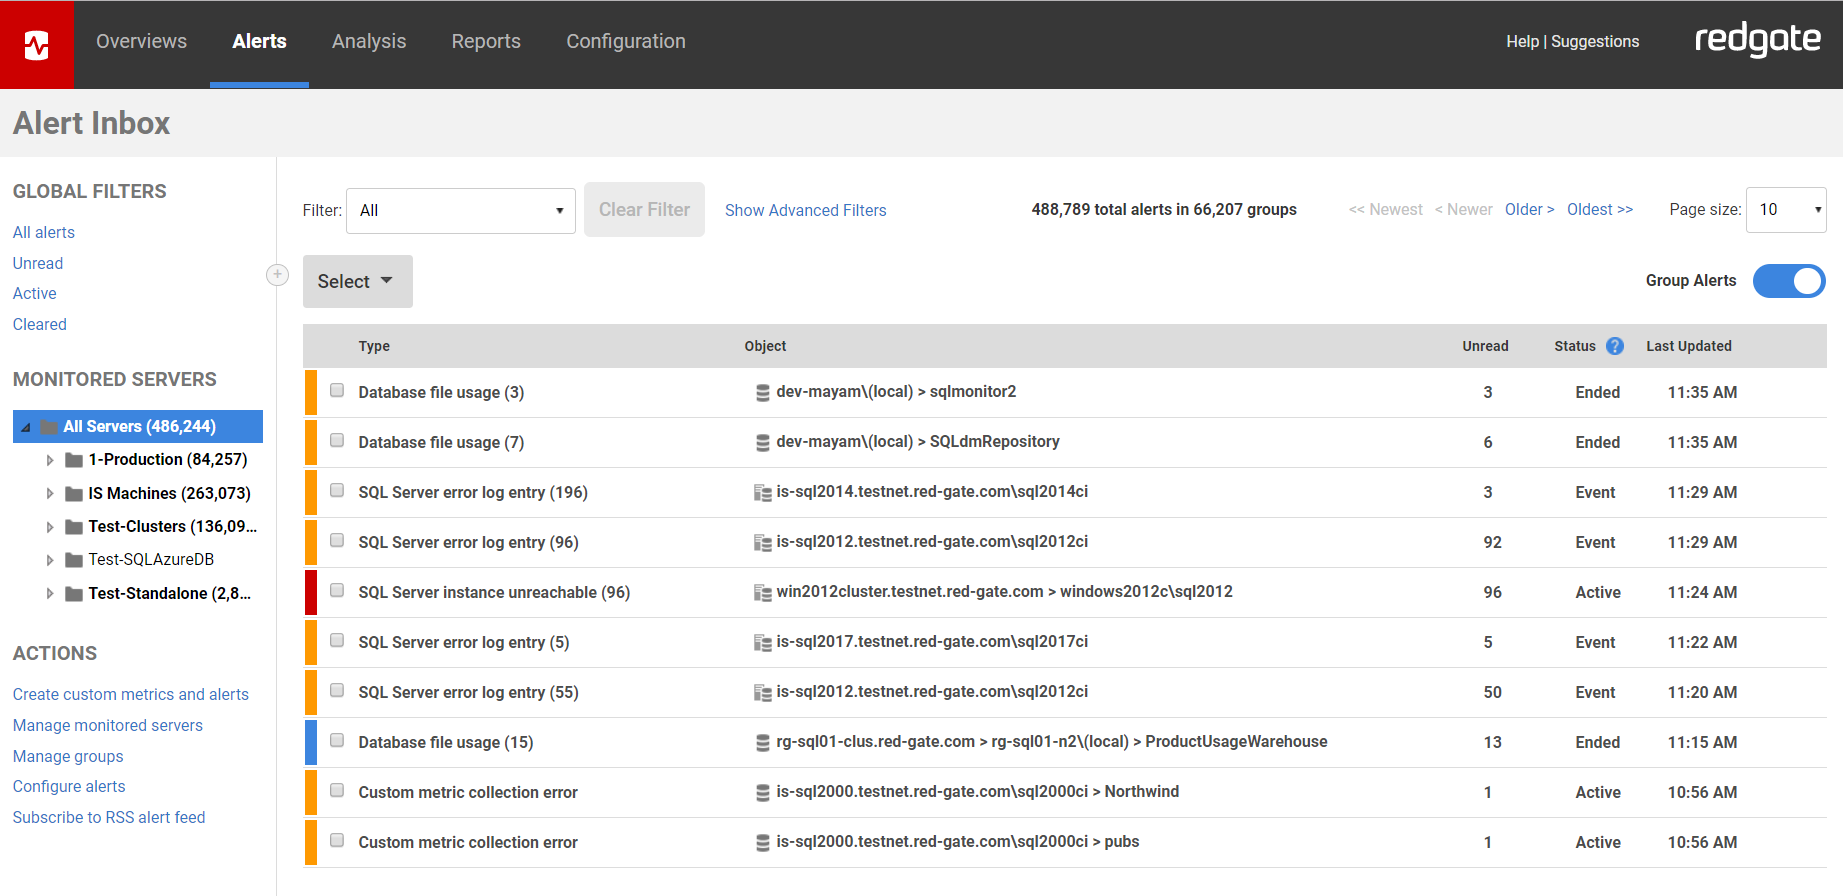
The status of each alert is shown in the Status column:
Grouping and Ungrouping Alerts
When you first install SQL Monitor, the Alert Inbox shows your alerts in groups. Alerts are grouped together by Alert Type and the object the alert was raised on, e.g:
- Disk space usage alerts are grouped by Machine and Disk,
- Backup Overdue alerts are grouped by Database
- Long Running Queries are grouped by query text
- etc
This view allows you to see more about what's happening on your estate at a glance.
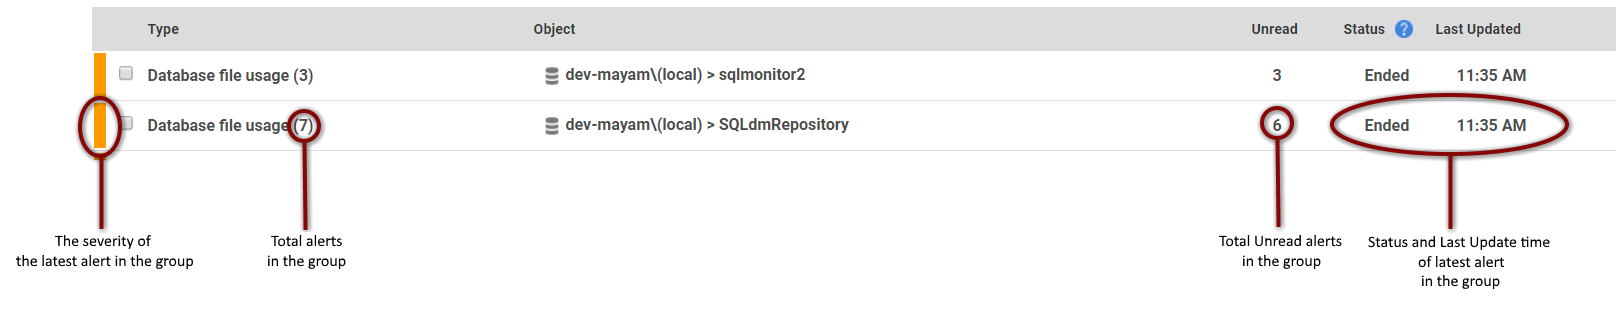
Each group shows details about the group as well as the latest alert within the group.
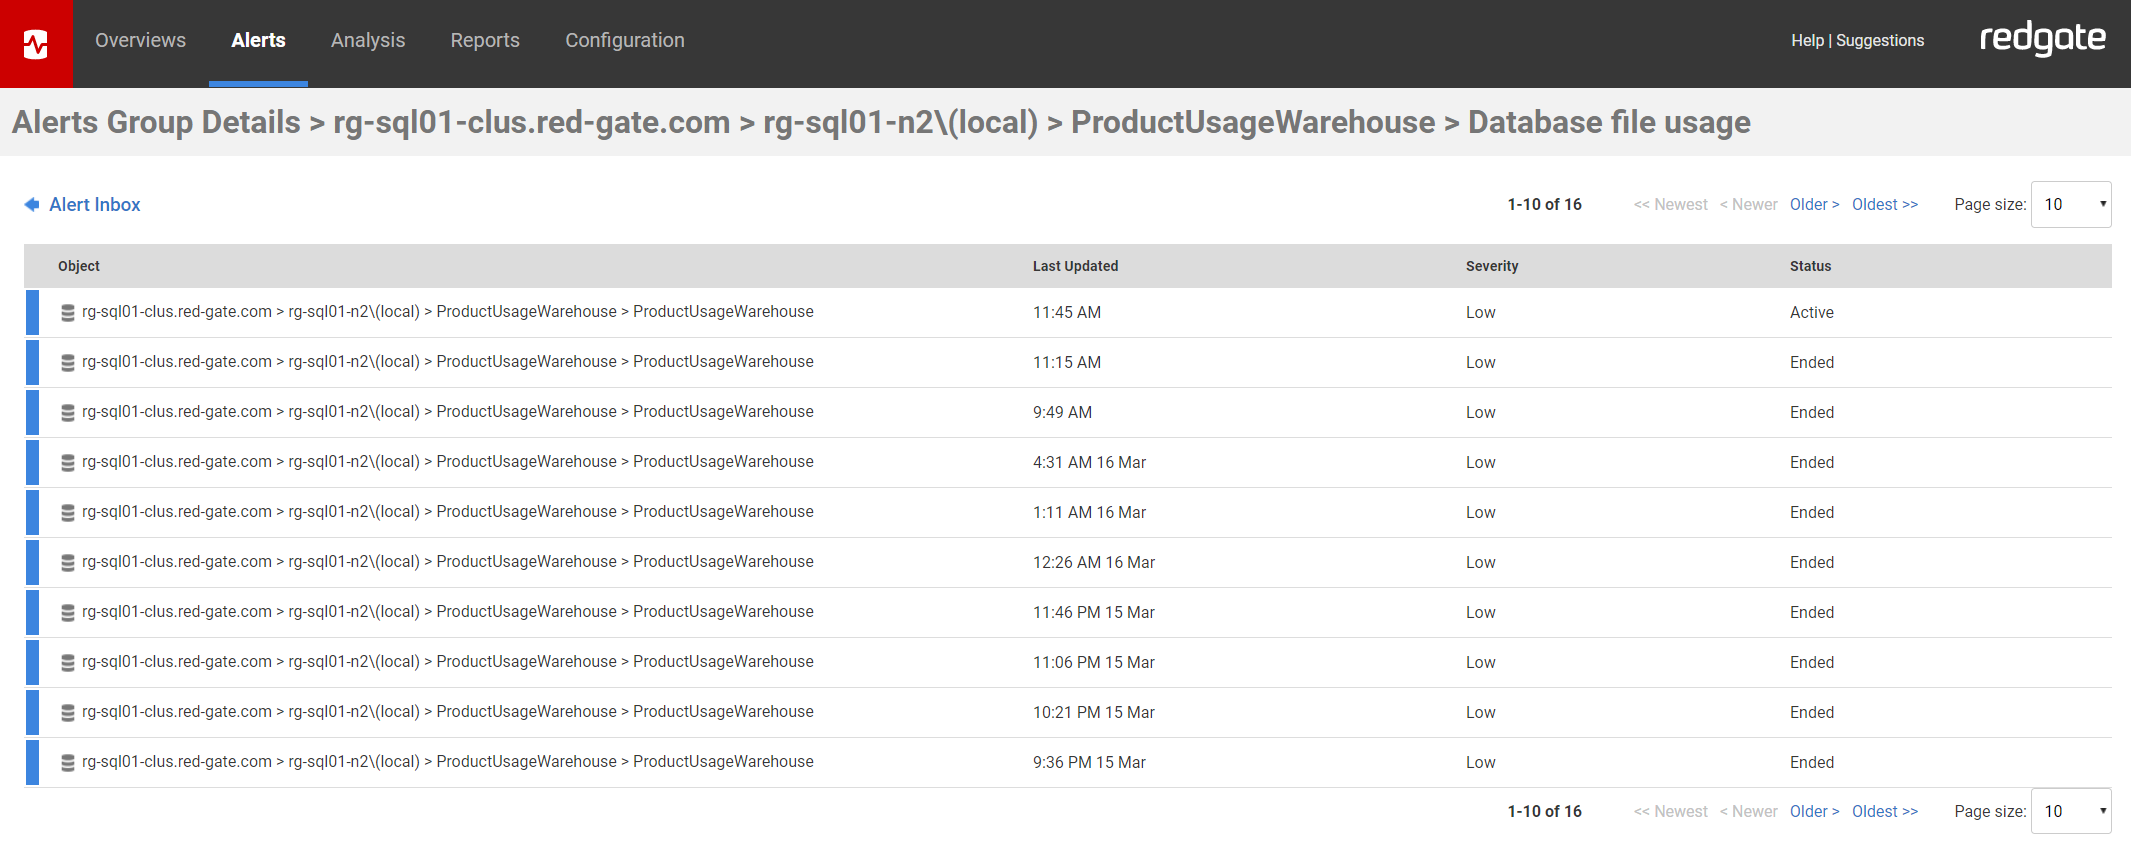
To see the alerts in each group, you can click it's row. To go back to the Alert Inbox, click the ← Alert Inbox link at the top left.
You may want to see your alerts ungrouped, so you can better see the order in which individual alerts are raised.

To do this switch the Group Alerts toggle off.
If you want to switch to the grouped view again, switch the Group Alerts toggle back on.

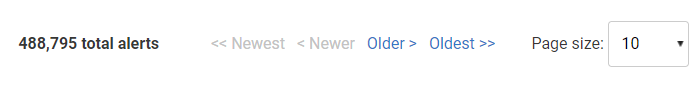
Seeing more alerts
When you first install SQL Monitor, the Alert Inbox shows a maximum of ten alerts per page.
- To view the next ten alerts, click Older.
- To view the last page of alerts, click Oldest.
- To increase the number of alerts shown, use the Page size option below the inbox:
Viewing alerts for a particular object
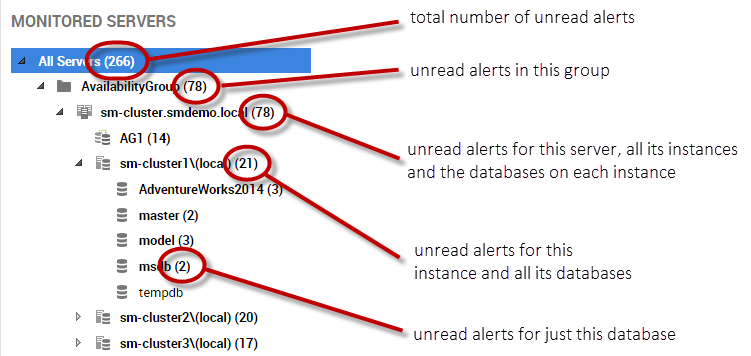
When you first click the Alerts tab, SQL Monitor always shows every uncleared alert across all your servers. Under Monitored servers, click on a group, host machine, SQL Server instance, or database.
To change the list of alerts displayed, continue to drill down in the Monitored servers list. Alerts are shown for the currently selected level and all levels below. If you select a host machine, for example, you will see:
- alerts raised for the machine itself (such as disk space or memory alerts)
- alerts raised for all instances running on it (such as job failed or error log entries)
- alerts raised for all databases on those instances (such as fragmented indexes or backup overdue alerts)
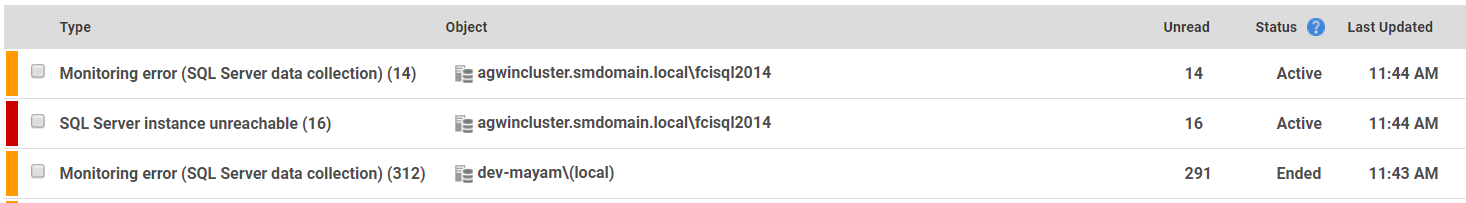
The number in brackets after an object in the Monitored servers list always shows the number of unread alerts, regardless of the current filters applied. As you drill down in the hierarchy, the number of unread alerts at each level is displayed:
The list of alerts is also filtered by whatever is set in the Filter drop-down.
How alerts are sorted in the Inbox
Event type alerts are sorted by the date they are raised. Continuous alerts (with the status Active or Ended) are sorted by the date they were raised, the last time their severity increased or when they ended.
Groups are sorted by the date of the most recent alert in the group.
Actions you can apply to alerts
To: | Do any of the following: |
Open an alert, in order to view its details on a separate page | Click anywhere in the row for the alert. |
| Open an alert in a new tab | Right-click on the alert and select Open in new tab. |
Mark an alert as read (only available for alerts that are currently unread) | Go to the Alert Details page (Alerts are automatically marked as Read when you visit this page). Select the alert using its checkbox: then click the Read button:
This is useful when selecting multiple alerts to mark as read. Open the alert: alert is automatically marked as read. Clear the alert: alert is automatically marked as read. |
Mark an alert as unread (only available for alerts that are currently read) | Select the alert using its checkbox then click the Unread button. This is useful when selecting multiple alerts to mark as unread. |
Clear an alert (Cleared alerts are hidden from the inbox by default) | Select the alert using its checkbox then click the Clear button. This is useful when clearing multiple alerts. |
Select one or more alerts | Select the checkbox Use Shift + Click to select a block of alerts. |
Configure an alert | Go to the Alert Details page and click Configure Alert... in the top right. Under Actions on the left side, click the Configure alerts link to go to the Alert settings main page, where you can adjust the settings for any alert at any level. See Customizing alerts. |

Selecting alerts
Selecting alerts is a useful way to apply actions to multiple alerts at once, rather than having to perform the action for each alert in turn.
Turn on the checkbox  next to each alert you want to select. Use Shift + click to select a block of alerts.
Selected alerts are highlighted in the inbox by row color.
Applying actions to selected alerts
Use the command bar above the Alert Inbox to apply actions to all the currently selected alerts:

Clearing or reading a selection of alerts may remove them from the Alert Inbox, depending on the current filter settings.
Using the Select button
Use the Select drop-down button to select large groups of alerts at once:
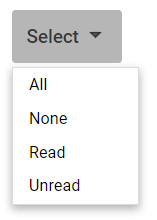
The Select option only applies to the current page of your filtered view. For example, if you are currently filtering the Alert Inbox to show only Medium Job failed alerts, and choose Read, then only Medium Job failed alerts that are marked as read are selected.
The Select drop-down list is context sensitive. If you are currently filtering the Alert Inbox to view only unread alerts, the Unread option will not be available.
Selecting alerts across multiple pages
When there are several pages of alerts, only the current page of alerts is selected by default. You can choose to apply the selection to all alerts on all pages:

If you choose this option, the message is updated:
![]()
Use the Older and Newer links to confirm that alerts are selected on other pages. Clicking Undo selection will undo the selection on all pages except the page where you first applied the selection.
Any actions you apply at this point, for example Mark as Read/Clear will be applied to all selected alerts on all pages.
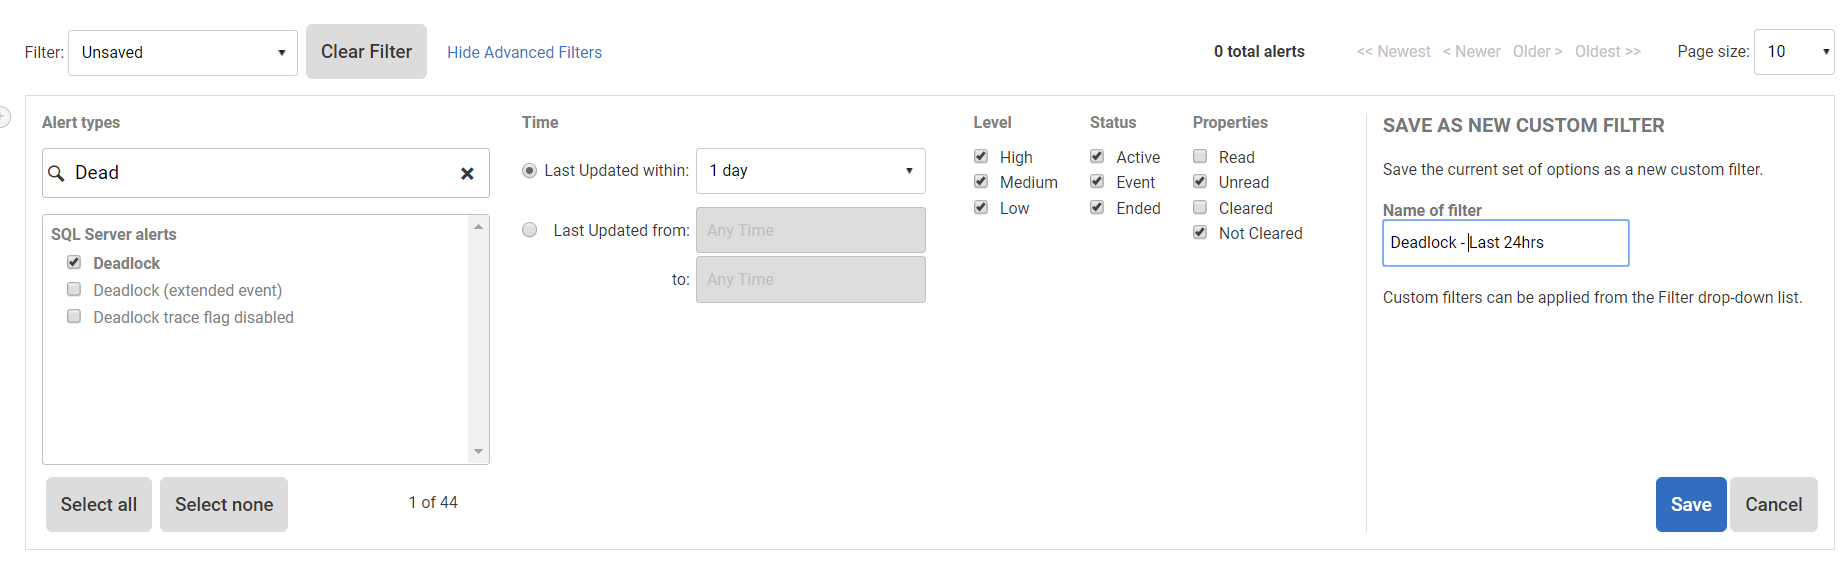
Filtering alerts
You can filter which alerts appear in the Inbox by any of their attributes:
- by level (Low, Medium, High)
- by status (Event, Active, Ended, Cleared)
- by type (e.g. Job failed, Backup overdue, or any selection)
- by action taken (Read, Unread)
- by time
SQL Monitor has built-in filters for the most common options you may want.
You can also create your own filters using the Advanced filters pane.
See Filtering alerts.
This documentation contains proprietary information and is protected by copyright law.
Copyright © 2026 Red Gate Software Limited. All rights reserved


