Viewing details of an alert
Published 08 March 2018
To view the details of raised alert, from the Alert Inbox, do one of the following:
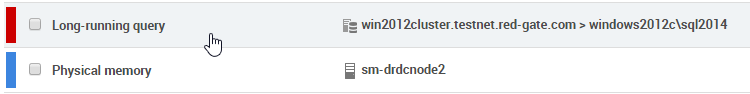
- In un-grouped mode, click anywhere in the row for that alert:
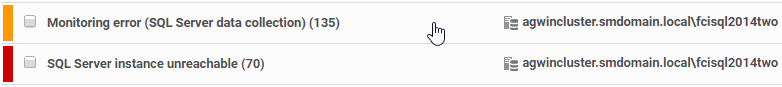
In grouped mode, first click anywhere in the row for that alert group to open the Alert Group Details page:
Then click anywhere in the row for the alert you are interested in:
If the alert group you clicked on contains only one alert, clicking the alert will take you straight to it.
When you open an alert, it is automatically marked as read.
Viewing newer or older alert details
You don't have to go back to the Alert Inbox or the Alert Group Details and select another alert to open it; you can navigate through different Alert Details pages by clicking Newer or Older.
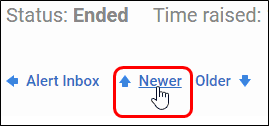
If the Alert Inbox was un-grouped, then once you've viewed details of an open alert, click Newer to display details of the alert listed directly above it in the Alert Inbox:
Similarly, click Older to display details of the alert listed directly below it.
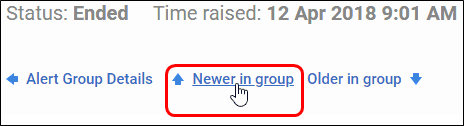
If the Alert Inbox was grouped, then once you've viewed details of an open alert, click Newer in group to display details of the alert listed directly above it in the Alert Group:
Similarly, click Older in group to display details of the alert listed directly below it.
What information is provided for an alert?
Alert details are organized into three main areas, from top to bottom:
Summary pane

Shows the current status of the alert and its raised time and (if applicable) its ended time.
Alert details area
The alert details area is organized into several tabs:
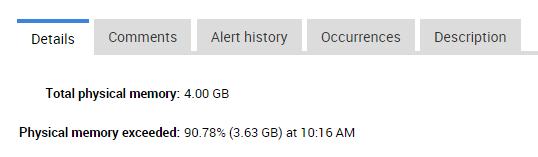
Details: general data showing the nature of the issue.
Comments: all comments that have been added for this occurrence of the alert.
Alert history: the lifecycle of this occurrence of the alert, displayed as a list of entries representing each significant change:
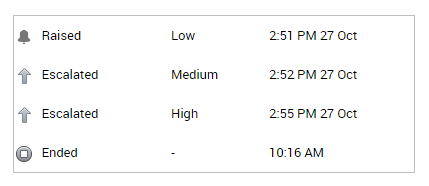
For continuous alerts that are frequently being escalated and downgraded over time, there may be a long list of entries. The maximum number of entries displayed in the Alert history page is 200. In the unlikely event that the number of entries exceeds this limit, the initial 100 entries and the most recent 100 entries are displayed.
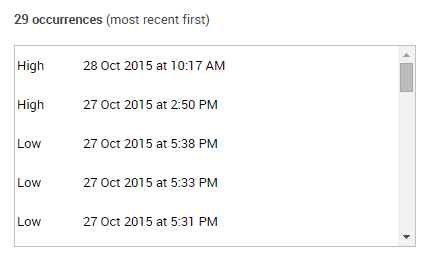
Occurrences: lists all alerts of this type raised for the current object, in order of time raised. Click on any occurrence to view its details.
Description: explanation of this alert, when it is raised, and links to further information.
Some alert types have an additional tab that contains more detail about the issue or related information.
Performance data area
The performance data area shows various performance counter values and process information captured around the time the alert was raised.
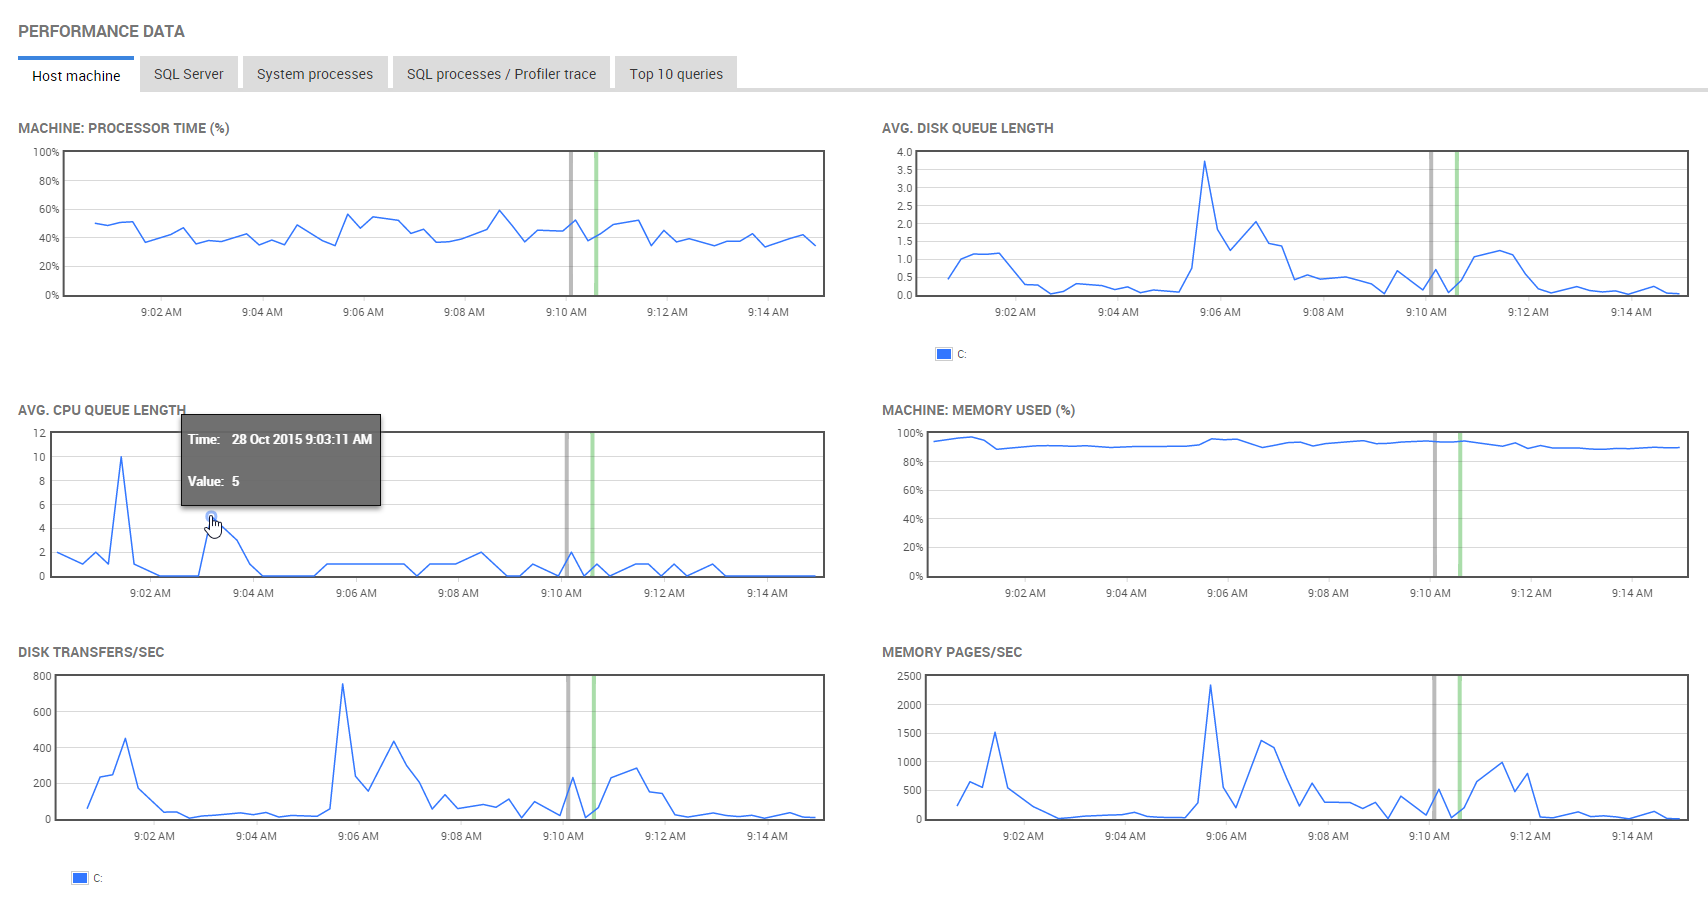
Host machine: shows graphs for metrics relevant to the host Windows machine (e.g. processor time, disk queue length).
SQL Server: shows graphs for metrics relevant to the SQL Server instance (e.g. user connections, buffer cache hit ratio).
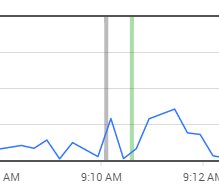
The alert raised time is represented by the vertical gray line. For alerts that have ended, the ended time is shown as a green line:
For each graph, you can do the following:
- Click anywhere on the graph to go to the Analysis page, with the metric and object pre-selected, so you can expand the time range.
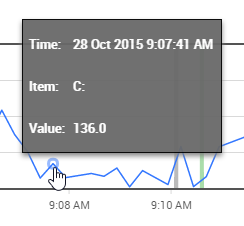
- Move your mouse pointer over a point on the graph to read the value:
The start and end times of all these graphs relative to the alert raised time will vary depending on the nature of the alert and when SQL Monitor last collected monitoring data.
System processes: A snapshot of the processes that were running at the time the alert was raised. The processes are sorted by name.
SQL processes/Profiler trace: A snapshot of the SQL processes that were running at the time the alert was raised.
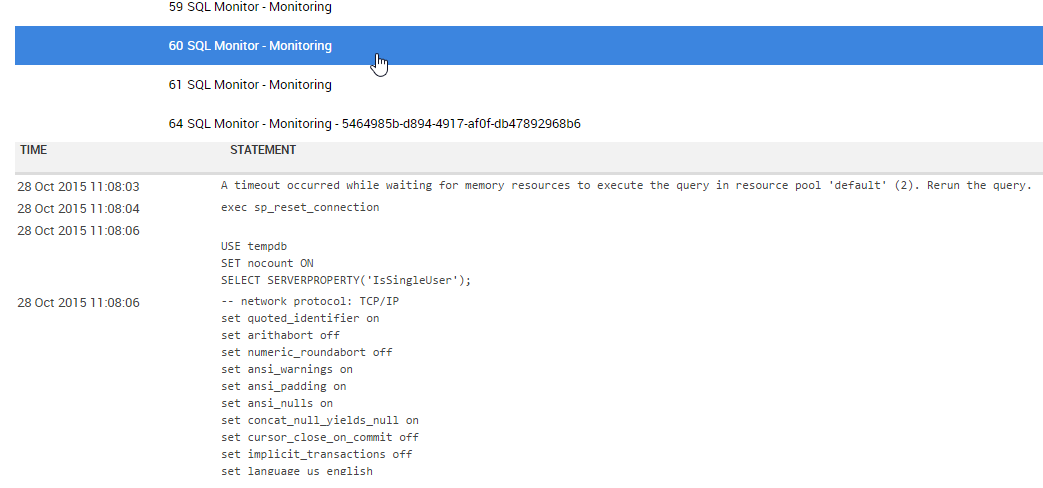
If you have enabled trace on the server on which this alert was raised, you can click on a SQL process in the list to view the detailed trace output:
Top queries: This tab is available for SQL Server alerts only. It shows the queries that used the most resources during the full duration of the alert, plus five minutes before the alert was raised and five minutes after it ended.
If this time adds up to less than 15 minutes (for example, if the alert only lasted for a minute), the duration shown will extend back further to make a total of 15 minutes.
This feature is not available for servers running Microsoft SQL Server 2000.
The table shows:
- Execution count - number of times the query was executed.
- Duration - how long it took (in milliseconds) to execute the query. By default, queries are listed in descending order according to this metric.
- CPU time - how much processor time (in milliseconds) was used to execute the query.
- Physical reads - the number of times a page is read into the buffer cache. If the page is in the cache already, it uses the page already in memory and does not generate a physical read.
- Logical reads - the number of times the database engine requested a page from the buffer cache.
- Logical writes - the number of times data is modified in a page in memory. If a page stays in memory for an extended period, more than one logical write may be required before it is physically written to disk.
- Database - the database the query was run against.
By default, Avg. per execution is selected; this lists queries based on average values over the time period selected. Click Totals to display queries based on total values.
To update the table manually, click on a column header containing numeric data. This generates a new table of queries based on that column; it doesn't just change the sort order of the queries you can see currently.
Click on a query to show the query statement, the latest query plan handle, and a list of waits that had the greatest impact during query execution. See Viewing query details. You can then expand the query details to show the query plan as an executable SELECT statement, and an expanded query statement that includes the full contents of the batch from which it originates. See Expanding query details.
Why is there no trace data?
- The selected session ID may not have any trace output associated with it.
- You have not enabled Profiler trace for this server. See Configuring Profiler trace.
Working with raised alerts
When you have read the details of a raised alert, you may want to do one of the following:
- Clear the alert

Clearing an alert hides it from the default "All" filter in the Alert Inbox. Clear alerts that you have investigated, or are not important to you. Cleared alerts are not included in the alert summary counts on the overview pages.
To view cleared alerts in the Alert Inbox, use the Cleared filter in the Advanced filter pane. - Unread the alert

When you open an alert, it is automatically marked as read. Use the Unread button to re-mark the alert as unread. - Add a comment

Adding a comment allows you to make a note about this occurrence of the alert.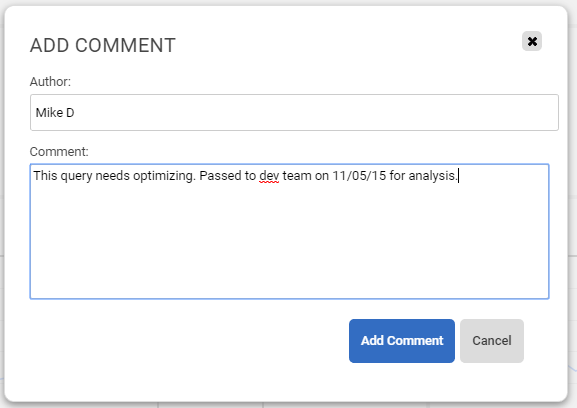
You can add further comments to an alert, and delete or edit an existing comment. Open the alert, and use the Comments tab to manage comments:
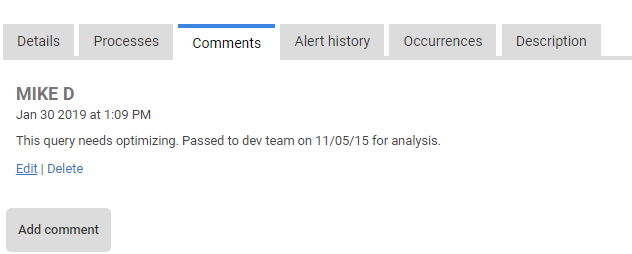
If you edit an existing comment, the timestamp for the comment is not updated. - Customize the alert
Customizing the settings for an alert is useful if alerts are being raised that you do not want to be alerted about in future, or if you want to adjust the thresholds that trigger the alert, or set up email notifications to be sent to colleagues. Click Configure alert: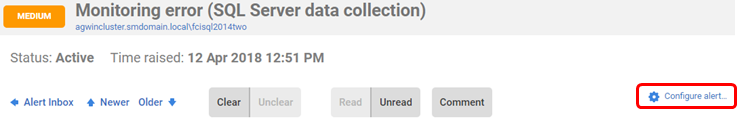
SQL Monitor takes you straight to the configuration settings page for the specific object, but you can choose to configure the alert at any level in the hierarchy. See Configuring alerts.
This documentation contains proprietary information and is protected by copyright law.
Copyright © 2026 Red Gate Software Limited. All rights reserved


