Setting up Webhook notifications (Preview)
Published 02 December 2019
About Webhook notifications
You can set up SQL Monitor to push alert notifications to a Webhook URL of your choosing.
Webhook notification messages are sent whenever any alert begins, escalates, deescalates, or ends.
Configuring Webhook notifications
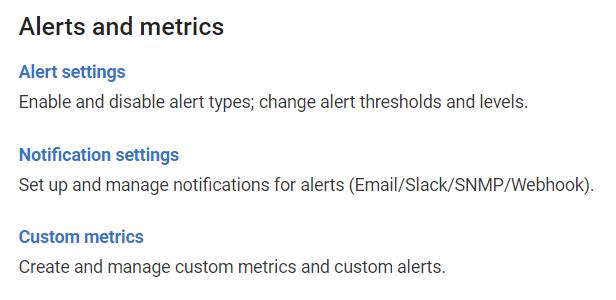
Go to the Configuration tab. Under Alerts and Metrics, select Notification settings:
Configuring SQL Monitor to send Webhook notifications:
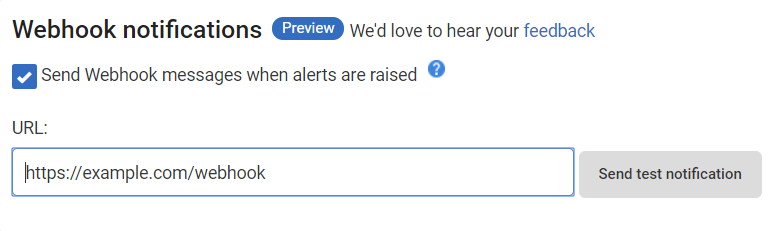
- Choose when SQL Monitor should send messages to your Webhook.
- Enter the Webhook URL into the URL box.
- Click "Send Test Notification" to check SQL Monitor can send messages to your Webhook.
- If you are using a proxy, please Proxy configuration at the end of this document.
Webhook Specification
- This feature is in preview. Please send suggestions to feedback.
- Webhook notification messages are sent after 20 seconds after the alert has been received.
- If the message fails to be delivered, a second attempt will take place after 10 minutes.
- Webhook messages are all predefined json payloads with the following content defined:
Field Definition
| Field Name | Value Description |
|---|---|
| messageType | Type of message - all alert notification messages will have the value of "AlertNotification". |
| id | Integer - Unique ID per alert. |
| name | Name of the type of alert - for example: "Long-running query" |
| description | Description of the alert - for example: "A SQL query runs for longer than a specified duration." |
| eventDateTime | Date/time of the event - ISO 8601 (UTC) for example: "2019-11-28T14:20:29.563Z" |
| statusChange | One of the following values:
|
| severity | One of the following values:
|
| previousSeverity | One of the following values:
|
| monitoredEntity.cir | Internal path representation for the monitored entity in question. For example: "Root[].[Cluster][[Name]=localhost].[SqlServer][[Name]=].[SqlProcess][[LoginTime]=28/11/2019 14:11:28;[SessionId]=59]" represents a SqlProcess. |
| monitoredEntity.groupName | Name of the SQL Monitor group within which the monitored entity is found. For example: "2 - Staging". |
| monitoredEntity.clusterName | Name of the cluster. (If it exists for the given context.) |
| monitoredEntity.machineName | Name of the machine. (if exists) |
| monitoredEntity.sqlInstance.name | Name of the SQL Instance. (if exists) |
| monitoredEntity.sqlInstance.displayName | Display name of the SQL Instance. (if exists) |
| monitoredEntity.sqlInstance.Alias | Aliased name for the SQL Instance. (if exists) |
| monitoredEntity.azureSqlServerName | Name of the Azure SQL Server. (if exists) |
| monitoredEntity.azureSqlDatabaseName | Name of the Azure SQL Database. (if exists) |
| monitoredEntity.azureElasticPoolName | Name of the Azure Elastic Pool. (if exists) |
| detailsUrl | URL to the given alert's details page within SQL Monitor. |
Sample Payload
{
  "messageType": "AlertNotification",
  "id": 1441792,
  "name": "Long-running query",
  "description": "A SQL query runs for longer than a specified duration.",
  "eventDateTime": "2019-11-28T14:20:29.563Z",
  "statusChange": "Raised",
  "severity": "Medium",
  "previousSeverity": "None",
  "monitoredEntity": {
    "cir": "Root[].[Cluster][[Name]=localhost].[SqlServer][[Name]=].[SqlProcess][[LoginTime]=28/11/2019 14:11:28;[SessionId]=59]",
    "groupName": "4 - Testing",
    "name": "localhost\\(local)",
    "machineName": "localhost",
    "sqlInstance": {
      "name": "",
      "displayName": "(local)"
    }
  },
  "detailsUrl": "http://sample.com:5000/show/alert/1441792?baseMonitorId=a3d6fc66-c5f0-468f-a510-2d793439ff74"
}
Proxy configuration
If using a proxy, you will need to configure SQL Monitor to use your proxy settings:
- Go to the machine running the base monitor service.
- Navigate to %ProgramFiles%\Red Gate\SQL Monitor\BaseMonitor
- Open RedGate.SQLMonitor.Engine.Alerting.Base.Service.exe.config and insert your proxy settings within a system.net element within the configuration element. An example is shown below:
<?xml version="1.0" encoding="utf-8"?> <configuration> <!-- Other config elements... --> <system.net> <defaultProxy> <proxy usesystemdefault="true" proxyaddress="http://192.168.1.10:8888" bypassonlocal="true" /> <bypasslist> <add address="[a-z]+\.example\.com" /> </bypasslist> </defaultProxy> </system.net> </configuration> - Save this file and restart the base monitor service.
This documentation contains proprietary information and is protected by copyright law.
Copyright © 2026 Red Gate Software Limited. All rights reserved


