Analyzing memory dumps
Published 25 May 2020
Analyzing memory dumps is currently in beta.
Getting started
Creating a memory dump
You can create a memory dump by opening a Task Manager, then right-clicking your .NET application on the Details page and clicking Create dump file:
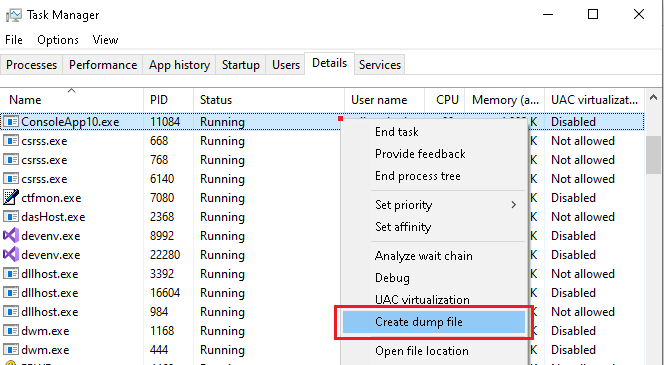
The memory dump will be created in a user temporary directory (e.g. %TEMP%\ConsoleApp10.DMP).
If your application targets 32-bit platforms and runs in a 64-bit environment, you should use 32-bit Task Manager located at: %WINDIR%\SysWOW64\Taskmgr.exe
Depending on the environment, different ways to create a memory dump may be available (e.g. on Azure).
Loading a memory dump
To get started, click Open memory dump button on the main screen:
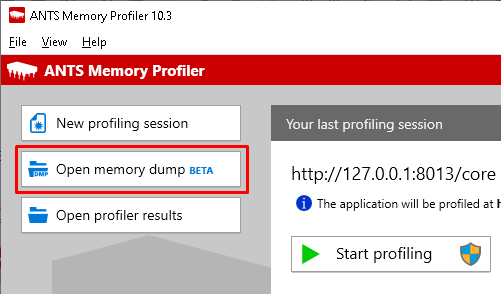
You can choose any .dmp file containing a memory dump of a managed .NET application.
Analyzing memory dump data
After a memory dump is loaded, you can analyze it the same way you would analyze profiling data from a regular profiling session.
For more information, see:
- The timeline
- The summary page
- The class list
- The instance categorizer
- The instance list
- The instance retention graph
- Object filters
- Opening classes in Visual Studio
Current limitations
As reading memory dumps is still under development, some data may be incomplete.
- Memory dumps of 64-bit applications can only be opened when running AMP in a 64-bit environment.
- Memory dumps of 32-bit applications can only be opened when running AMP in a 32-bit environment.
- Memory dumps of applications targeting .NET Framework 3.5 and older cannot be opened.
- When analyzing a memory dump, Instance retention graph can show limited data or errors.
- When analyzing a memory dump, tracking IDisposable objects is not yet possible.
This documentation contains proprietary information and is protected by copyright law.
Copyright © 2026 Red Gate Software Limited. All rights reserved


