The Assemblies loaded in the CLR pop-up
Published 14 May 2018
Information about dynamically generated assemblies is only shown in ANTS Memory Profiler 8.2 and later. It's not available for .NET 2, or when attaching to a process.
If you want to see the assemblies loaded in a .NET 2 application, see Forcing your application to use .NET 4.
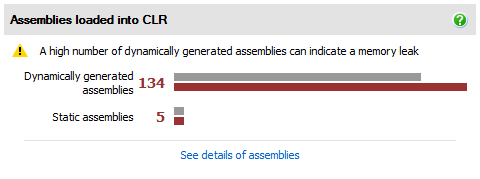
To open the Assemblies loaded in the CLR pop-up, in the Assemblies loaded into CLR section on the summary page, click See details of assemblies:
The pop-up gives details of the assemblies loaded into your application in the current snapshot:
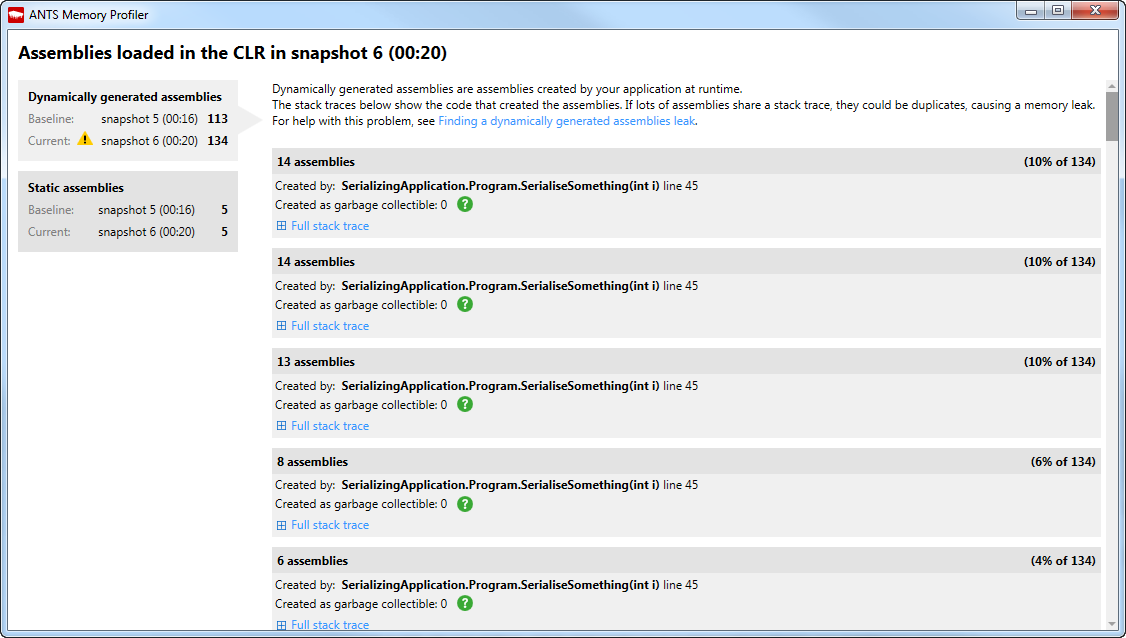
Dynamically generated assemblies
Dynamically generated assemblies are created by your code at runtime. As a result, they don't have meaningful names. To find out what the assemblies are, look at the stack trace that created them.
The pop-up shows you the assemblies generated by your application. If any assemblies were created by the same stack trace, they're grouped together.
Click Full stack trace to expand a stack trace:

If there are lots of dynamically generated assemblies created by the same stack trace, they could be duplicates, which means they're causing a memory leak. For more information, see Finding a dynamically generated assembly leak.
The pop-up shows how many of the assemblies were created as garbage collectible. For more information on collectible assemblies, see Collectible Assemblies for Dynamic Type Generation (MSDN).
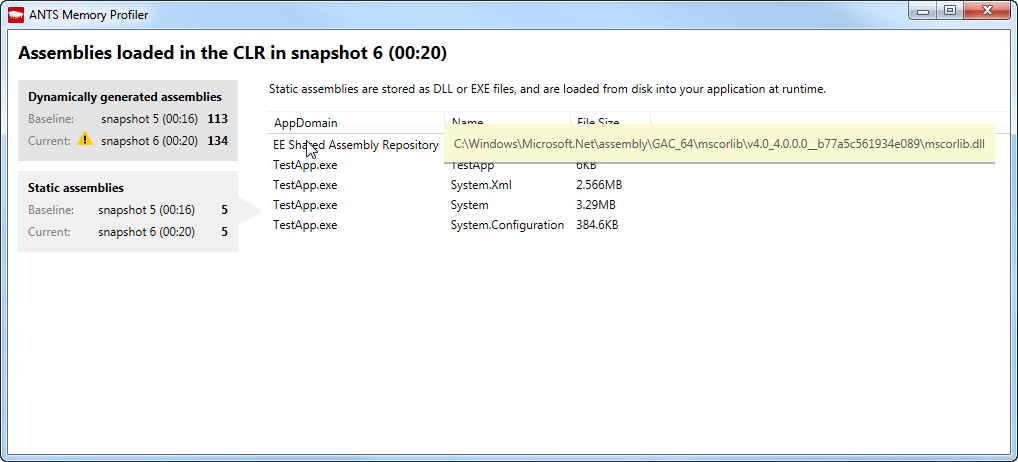
Static assemblies
For static assemblies, the pop-up shows their AppDomain, name, and size. Move your mouse over an assembly to see its path.
This documentation contains proprietary information and is protected by copyright law.
Copyright © 2026 Red Gate Software Limited. All rights reserved


