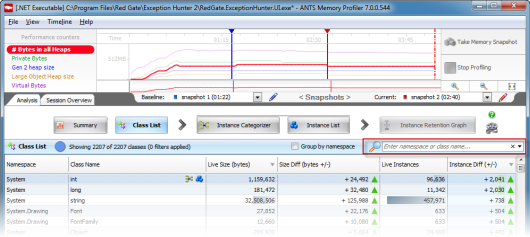
The class list
Published 18 December 2012
Use the class list to identify classes which you do not expect to be in memory, or classes with unexpectedly high memory usage. To restrict your investigation to objects with specific characteristics or specific parts of the application, use filters.
The class list shows detail of memory usage per class. On the summary or class list, look for classes with unexpectedly high memory usage, or a large increase in size between snapshots.
When you enable filters or use the search box, the values in the list only include objects that match the selected criteria.
If you are checking where most memory is used, it can be useful to start by looking at Live size or Live instances. Click on the column heading to sort the column, and look for classes with an unexpectedly large size or number of instances.
Right-click on a class and select Show instance categorizer to see where instances of the class are being referenced.
If you are looking for a memory leak, it can be useful to begin by looking for unexpected differences between two snapshots in the Size diff or Instance diff columns. Click on the column heading to sort the column, and then look for classes where the memory usage or instance count has increased significantly.
Use the Comparing snapshots filters to focus your analysis, depending on the snapshots you are comparing:
- If you are looking for objects which exist in both the baseline and the current snapshot, select Only surviving objects;
- If you are looking for objects which were created between the two snapshots, select Only new objects.
After selecting an appropriate filter:
- If the class that looks interesting is one you recognize, right-click and select Show instance list to look for instances of the class.
- If the class that looks interesting is not one you recognize, right-click and select Show instance categorizer to find out where instances of the class are being referenced.
If your application has more than one process, select the process from which you want to view the classes by using the Process drop-down list. This isn't displayed if your application only has one process.
A process followed by an exclamation mark (!) after its name was not running when the current snapshot was taken (either because it had already finished, or because it had not yet started).
Finding a specific namespace and class name
To find a specific namespace or class, type part of the name in the find box. This can be useful, for example, if you are checking back on a memory leak you have fixed. In many cases, we do not recommend starting your investigation by looking for specific classes; instead, start by looking at the size or instances columns.
We recommend this approach because a lot of the code being executed by your application is likely to be part of the .NET framework libraries or other third-party libraries, so you are likely to see leaks in classes which are not your own, even where your code is the cause of the leak.
Live size and Live instances
The Live size column shows the total size of instances of the class in the current snapshot.
The Live instances column shows the total number of instances of the selected class in the current snapshot.
The values do not include instances of classes referenced by the selected class.
These values can be good starting points for finding out where most memory is being used by your application.
To investigate why a class has a large size or high number of instances, do one of the following:
- look at instances of the class on the instance list
- use the instance categorizer to investigate whether another class is keeping instances of your class in memory unexpectedly.
Unmanaged size
The Unmanaged size column shows you how much unmanaged memory each class references. The column is only displayed if you selected Profile unmanaged memory allocations when setting up the profiling session. It's not available on Windows XP / Server 2003 and earlier, or when profiling .NET 1.1 applications.
ANTS Memory Profiler can't always associate unmanaged memory with classes that reference it, so the actual unmanaged size may be greater than shown here.
For example, this is the case if the pointer to unmanaged memory is contained within a struct.
Size diff and Instance diff
When you compare two snapshots, the Size diff and Instance diff column show the differences between the baseline snapshot and the current snapshot.
An unexpected increase in the size of a class or number of instances may indicate a memory leak. For example, if you perform an action where you expect new objects to be cleaned up between the snapshots (such as opening and closing a dialog box), you would not expect the class to increase in size or the number of instances to increase.
In some cases, an increase in size or number of instances may not indicate a leak:
- For an application that includes a text editor, the size of the text buffer would be expected to increase as the user adds more text to a document. In this case, the Size diff column for the text buffer class shows an increase in size, but this is not an indication of a memory leak.
- For an application with a text editor backed by a DOM, the number of nodes of a DOM would be expected to increase. In this case, the Instance diff column for the DOM classes shows an increase, but this is not an indication of a memory leak.
The Instance diff column has a specific purpose when either of the following filters is enabled:
- From the current snapshot, show only survivors in growing classes.
- From the current snapshot, show only zombie objects.
See Basic filters for more details.


