The instance list
Published 18 December 2012
The instance list shows information about all instances of a class. This can help to identify instances that may be the cause of a memory problem.
When you apply filters, the instance list only includes the filtered objects.
The instance list is useful for understanding what instances of a class are in memory, and for identifying objects which are likely to be involved in a memory leak.
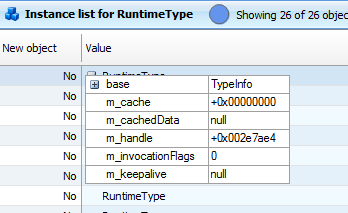
Select an instance and then click in the Value column to find out more about the properties of the specific instance.
You can't see the properties of an instance if you selected Make snapshots faster by leaving out object values when setting up the profiling session, or if the snapshot was bigger than 4GB.
New object
The New object column indicates whether the object was created between two snapshots you are comparing, or whether it existed already in the earlier snapshot. (This column is only populated when you are comparing two snapshots.)
When you are comparing two snapshots, either Yes or No in the New object column may be an indication of leaked objects, depending on when you took your snapshots.
- Yes may indicate a memory leak when you are comparing snapshots and you expect instances of the selected class to be cleaned up by the garbage collector between snapshots. For example, you take a snapshot before and after opening and closing a dialog box. Objects created by the action should be cleaned up before you take the second snapshot, so new objects in the second snapshot are likely to indicate a memory leak.
When you investigate these new objects further, apply the New objects filter; this ensures you are only looking at objects which are new in the second snapshot.
- No may indicate a memory leak when you are comparing snapshots and you expect instances that exist before the first snapshot to be cleaned up by an action you take between snapshots. For example, you populate a list with data, and then take a snapshot before and after clearing the list. Objects created before the first snapshot should be cleaned up before you take the second snapshot, so old objects in the second snapshot are likely to indicate a memory leak.
When you investigate these objects further, apply the Surviving objects filter; this ensures you are only looking at objects which exist in both snapshots.
Unmanaged size
The Unmanaged size column shows you how much unmanaged memory each instance references. The column is only displayed if you selected Profile unmanaged memory allocations when setting up the profiling session.
ANTS Memory Profiler can't always associate unmanaged memory with instances that reference it, so the actual unmanaged size may be greater than shown here.
For example, this is the case if the pointer to unmanaged memory is contained within a struct.
The duplication icon shows that some other instances have unmanaged memory in common with this instance.
Click on the icon for an instance to see which other instances share unmanaged memory with it:
Hover over the icon for another instance to see how much memory it shares with the instance you selected:
GC root object
The GC root object column indicates whether the object is a GC root object. A GC root can be any storage slot to which the running program has access, such as a local variable, static variables, or a CPU register. (Note that the object itself is not the GC root; the storage slot that holds the reference to the object is the GC root.)
When the garbage collector runs, it determines which objects are not garbage by 'walking the heap', starting at the GC roots. Objects which can be reached by following a chain of references from a GC root are designated as not garbage, and are not collected.
To find out why an object in the instance list is a GC root, select it and then click . Information on the graph shows why the object is a GC root.
GC root objects are not usually the source of memory leaks. However, they can be useful in finding memory leaks because there is always a chain of references between the leaked object and one or more GC roots. To enable the garbage collector to clean up the object, you need to break this chain of references by changing your code to remove one of the "links" in the chain.
The GC root object column shows 'Yes - Weakly Referenced' if the object is weakly referenced. Objects with weak references are often used for caching because these objects can be destroyed by the garbage collector if memory becomes low. For this reason, weakly referenced objects are not usually the source of memory leaks.
Distance from GC root
The Distance from GC root column shows the number of references in the chain between the object and its nearest GC root.
It is likely that shorter, more obvious chains of references between objects and their GC roots have been broken already. Often objects which are at a greater distance from a GC root may be involved in a memory leak, because the chain of references from the GC root to the object is more complex.
Size with children
The Size with children column shows the size of the object and any object that it references that is further away from a GC root. This means that the value is a realistic estimate of the amount of memory that would be saved by removing a particular object from memory.
Row count limit
By default, the instance list will show a maximum of 1,000,000 objects for performance reasons. To modify this limit, create a DWORD registry value called
HKEY_CURRENT_USER\SOFTWARE\Red Gate\ANTS Memory Profiler 8\MaxObjectsToDisplay
and set it to the new limit. To disable the row count limit, set the value to 0.


