These pages cover ANTS Performance Profiler 10, which is not the latest version. Help for other versions is also available.
ANTS Performance Profiler 8.1 release notes
Published 14 May 2018
June 19th, 2013
Fixes
Introduced a work around to stop applications crashing when line-level timings are enabled and SecurityTransparent / partially-trusted code is used.
Previous versions of ANTS Performance Profiler have had problems when using line-level timings with code using the SecurityTransparent attribute and partially-trusted code:- Web applications running on IIS typically crashed with a VerificationException, and the user saw an HTTP 500 error.
- For other types of application, only method-level timings were shown.Some third-party assemblies that are popular among web developers are particularly affected by this problem, for example log4net on .NET 4 and JSON.NET.
To work around the problem, ANTS Performance Profiler only shows method-level timings for assemblies that are likely to cause crashes. Results for other assemblies in the application will be shown at line-level as normal.
For more information, see Profiling SecurityTransparent and partially-trusted assemblies.- A number of display problems when viewing the Performance Profiler in a high DPI mode.
- Fixed a major cause of UIQueue.DispatchSync errors.
Thanks to everyone who reported this problem in version 8.0 via our error reporting system.
Other changes
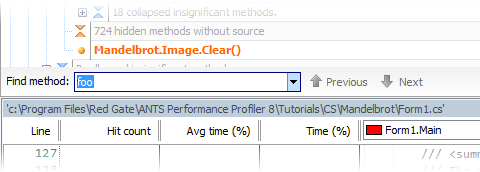
We've fixed a number of long-standing annoyances with the Find options in the Call Tree.
In previous versions of ANTS Performance Profiler:
- It wasn't clear whether you were searching the call tree or the source code
- If the method wasn't found, the only feedback was that the Previous and Next buttons were disabled
- You had to click the Next button to search; pressing the Enter key didn't perform the search
ANTS Performance Profiler 8.0:
ANTS Performance Profiler 8.1:
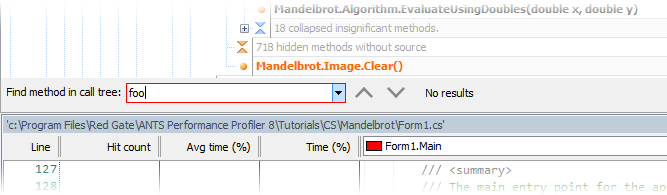
You can also now start searching by pressing the Enter key after typing the method name.
There are a few other problems with Find in the call tree that we haven't been able to fix. Most notably:
- You can't search within SQL queries or HTTP requests
- You can't find async continuation methods
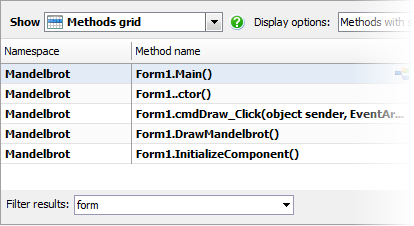
In the Methods Grid, we've made it more obvious that the old Find option is actually a filter, which filters the list: