Profiling File IO
Published 14 May 2018
ANTS Performance Profiler lets you record when your application reads from and writes to discs, including network drives. If your application is performing poorly and writes to disc over a slow or unstable network connection, for example, I/O profiling may help you locate performance problems.
Profiling File I/O is only available in ANTS Performance Profiler Professional edition, and on Windows Vista or later, or Microsoft Server 2008 or later.
Profiling File I/O isn't available for Windows Store apps, because WinRT apps have limited access to the file system. But you can collect I/O information in any other type of profiling session by clicking a check box when you're setting up.
Setting up File I/O profiling
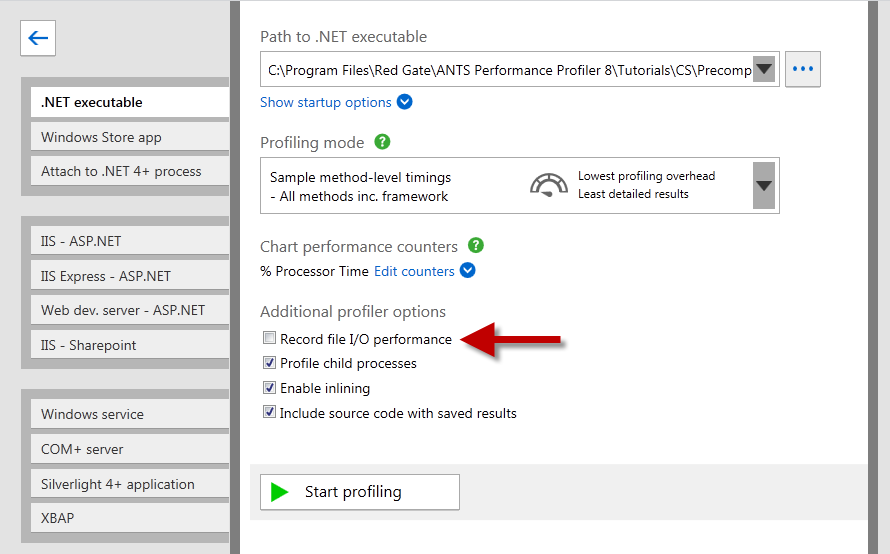
You can enable File I/O profiling when you set up a profiling session.
File I/O profiling is listed under the Additional profiler options for each type of session:
To set it up, ensure the check box is selected, choose your other options and performance counters, and click Start profiling.
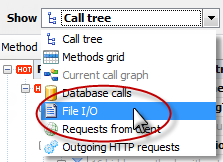
Once profiling starts, the profiling results view shows the call tree. From the Timing Options dropdown menu, select Wall-clock time (CPU time does not include time spent blocked waiting for File I/O). When you have identified a slow line of code which involves reading from or writing to a disc, from the profiling results view dropdown menu, select File I/O.
Viewing File I/O results while profiling
- Select the portion of the timeline that you are interested in; see The timeline.
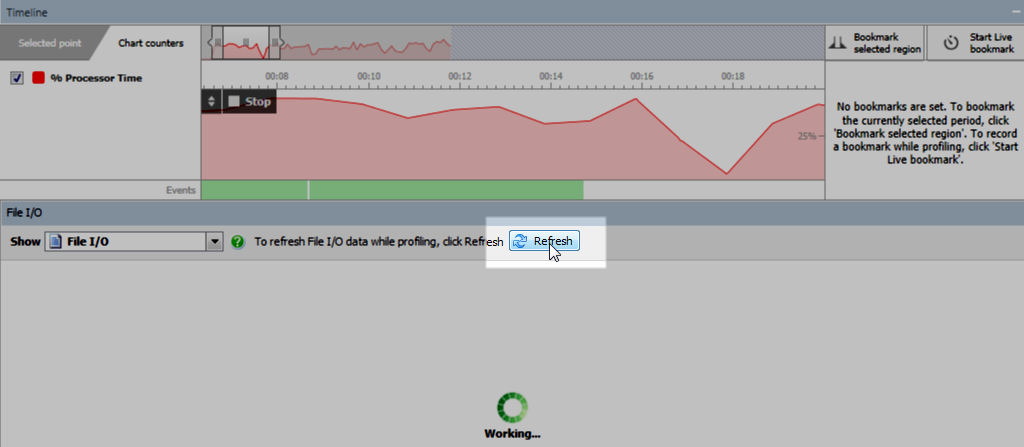
- On the Show menu, select File I/O.
Note that the timeline isn't automatically updated while profiling File I/O. To display queries performed since you switched to File I/O view, click Refresh:
Viewing File I/O results after profiling
If profiling has finished, select File I/O from the Show menu.
Linking back to your code
To find which of your code's methods caused File I/O to occur:
- Select the time when the I/O occurred on the timeline.
Include some time just before the I/O because the method which caused the I/O will be called before the I/O takes place.
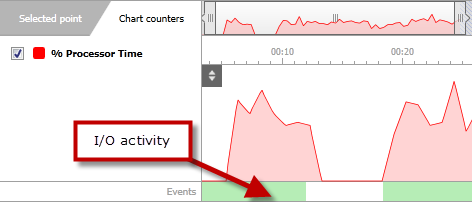
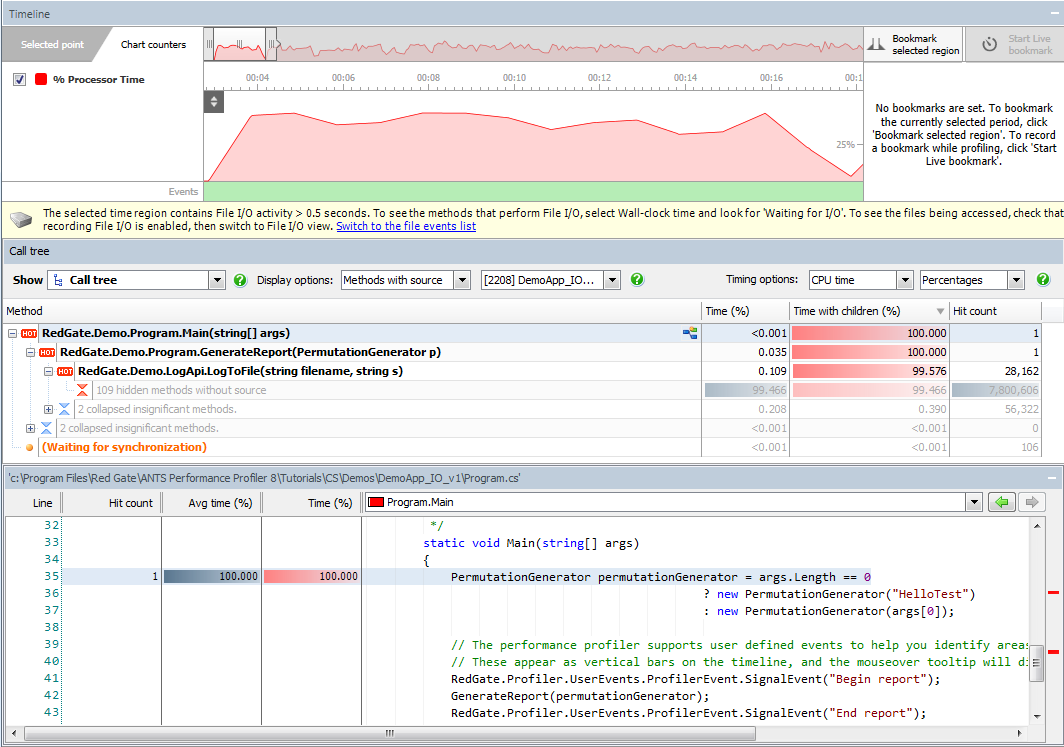
Areas with I/O activity are shown with green shading in the events bar: - Select the area you're interested in on the timeline, and switch back to the Performance view by selecting Call tree from the profiling results view dropdown menu.
- Under Tree View Display Options, select Methods with source.
- In the tree view, the method which caused the File I/O should be found in the area you selected:
Line-level timings can be used to look for code that could be optimized.
