Worked example - Profiling an ASP.NET application
Published 28 August 2014
This worked example describes how to profile a sample ASP.NET website called NerdDinner. You can download the original ASP.NET MVC source code for NerdDinner from CodePlex: in this example, the NerdDinner code has been modified to illustrate a performance problem.
In this example, NerdDinner is installed on the same computer as the one being used to profile it, and can be accessed in a web-browser at http://127.0.0.1:8010 .
Imagine that the problem with NerdDinner is that it is slow to return results for a search involving a SQL query. Imagine you want to know whether you can do anything in the application's .NET code to improve the site's performance, before you investigate performance on the database, or spend money to improve the hardware the site runs on.
There are three main steps:
- Set up ANTS Performance Profiler
- Use NerdDinner
- Analyze the profiler's results
Setting up ANTS Performance Profiler
To set up ANTS Performance Profiler:
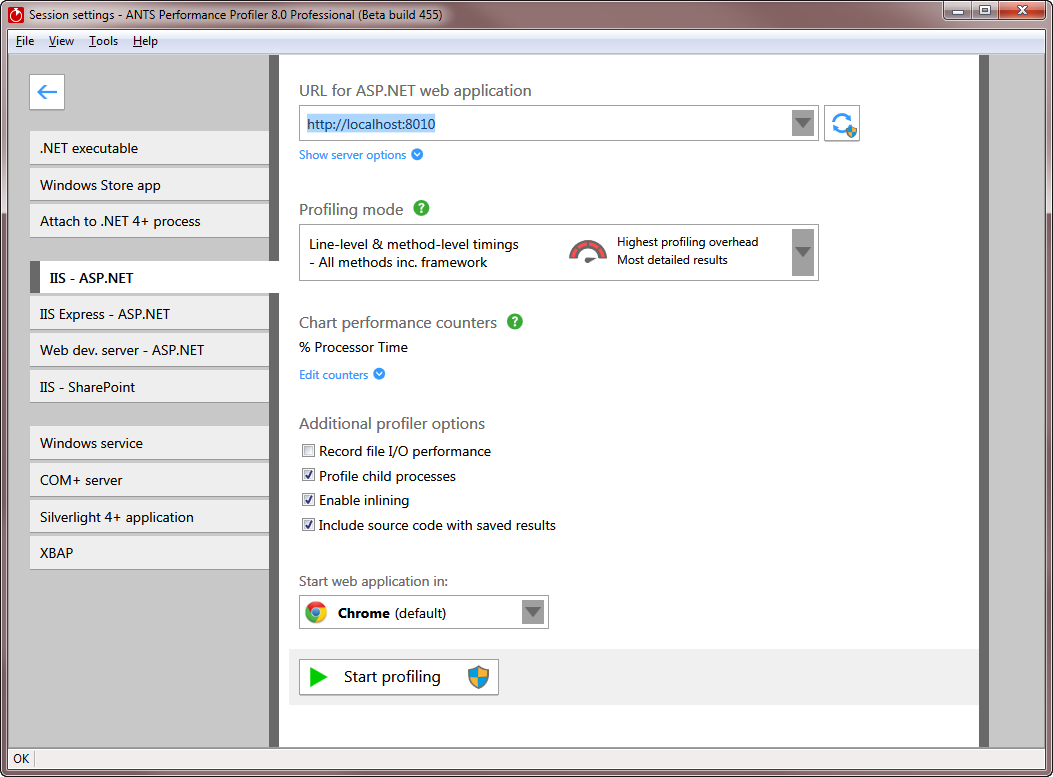
- In the ANTS Performance Profiler settings, on the Application Settings tab, select ASP.NET web application (IIS).
- In the ASP.NET web application (URL) dropdown menu, select the site's URL: http://127.0.0.1:8010.
- Choose the required profiling mode. Here, we'll use line-level and method-level timings.
For more on profiling modes, see Choosing a profiling mode.
- Select the port on which to profile your application:
- If you are using IIS 6, 7 or 8, select Unused port and choose a port that is not used by IIS.
IIS will start a new instance of your application on the specified port.
Note that this will not work if your application's code binds to a specific port. - If you are using IIS 5, or if you are using IIS 6+ and your application binds to a specific port, select Original port.
IIS will restart so that the profiler can attach to the port.
Note that restarting IIS stops IIS and restarts only the application that you are profiling. Other websites on the same IIS instance will not be present when IIS restarts.
The port where the application will be profiled is displayed at the bottom of the ANTS Performance Profiler Settings dialog box.
For more on profiling web applications in IIS, see Profiling ASP.NET applications running on IIS and Troubleshooting IIS profiling. - If you are using IIS 6, 7 or 8, select Unused port and choose a port that is not used by IIS.
- Click
 .
. - The web browser you selected launches and loads NerdDinner.

Using NerdDinner
In this example, the NerdDinner site includes several pages that rely heavily on database queries, as well as some static HTML. Imagine users have reported that the site's location search feature is slow: we start the investigation by exercising that feature, entering a place name in the search box and hitting Search. The search is designed to return a list of events near a certain location.
While we use the site, ANTS Performance Profiler's timeline shows the CPU usage the application has caused:
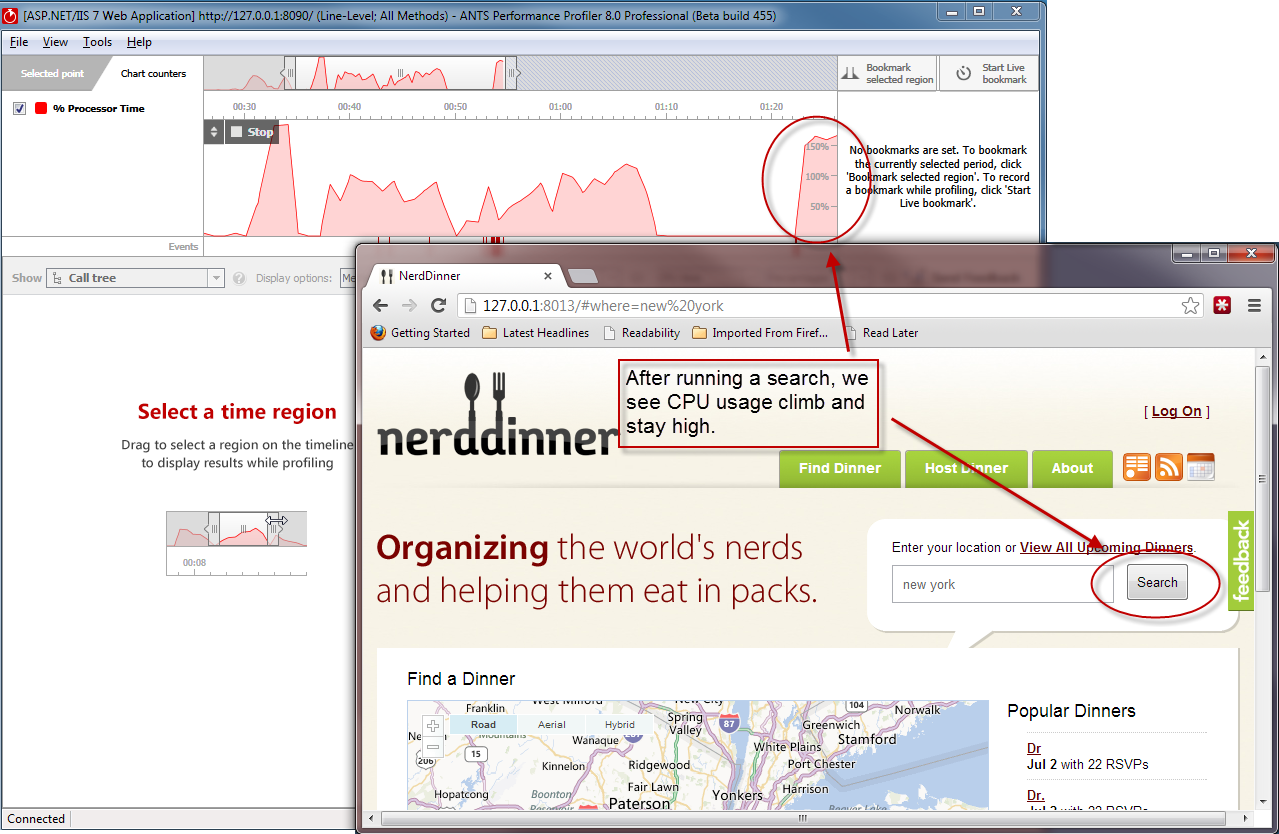
There's a brief, expected CPU peak when the site launches. CPU then returns to near zero until we start our search, when it begins to grow to nearly 200%, staying high for long after the first results were returned. This clearly indicates a performance bottleneck in the search feature.
For more information on analyzing CPU usage, see The timeline.
Now we see where the bottleneck may lie, we can explore the results in detail: In the ANTS Performance Profiler window, click  to stop profiling.
The website closes.
Analyzing the profiler's results
After a few moments, full results are shown.
At the top of the call tree, ANTS Performance Profiler shows the 'hottest' stack trace; that is, the code that contributes the greatest proportion of CPU time. This is usually a good place to start looking for opportunities to optimize the code.
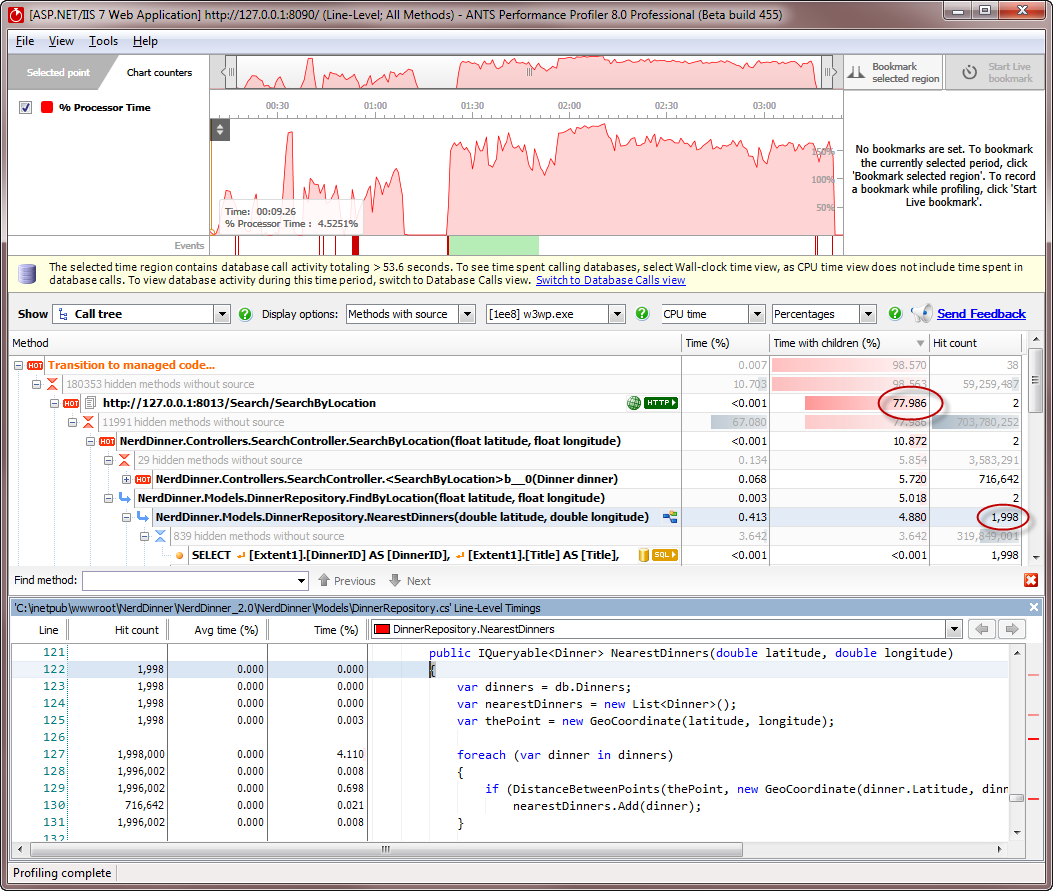
At the top of each call tree stack, we see the HTTP request that triggered the calling of the .NET methods. As we expected, the hottest stack trace during the whole profiling session descends from the request http://127.0.0.1:8013/Search/SearchByLocation, child methods of which account for about 78% of the total time spent in the profiling session. (Notice that the port used for profiling, 8013, isn't the same as the original port, 8010).
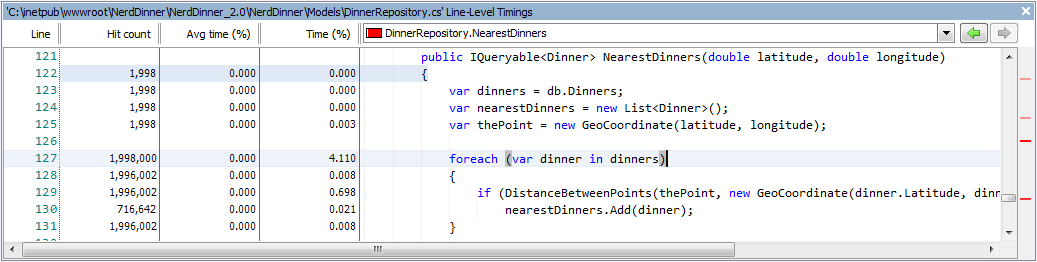
Looking down the hot stack, we can see that this request called a .NET method, NerdDinner.Models.DinnerRepository.NearestDinners(double latitude, double longitude), that was hit 1998 times - as was the SQL SELECT query it ultimately runs.
For more information on hot stacks and HTTP nodes, see The call tree.
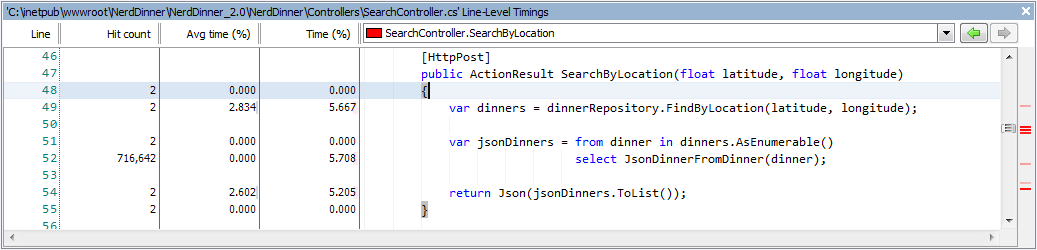
If we select the method's parent, NerdDinner.Controllers.SearchController.SearchByLocation(float latitude, float longitude), we can view its source code. Because we used a profiling mode with line-level timings, we can also see where inside the method the greatest time was spent. This shows us that the method retrieves the full list of all recorded events from the database:
The method NerdDinner.Models.DinnerRepository.FindByLocation(float latitude, float longitude) then tries to process the result set in the web page, to filter by location:
These methods are good candidates for optimization. The same results could be achieved via AJAX calls, and by returning from the database only events that meet specified latitude and longitude criteria.
For more on the source code view, see Source code.
Switching to Database Calls view, we can see that the query to return the full results set was run thousands of times, summing to nearly 16 seconds just to return the first result for all the instances of the query:
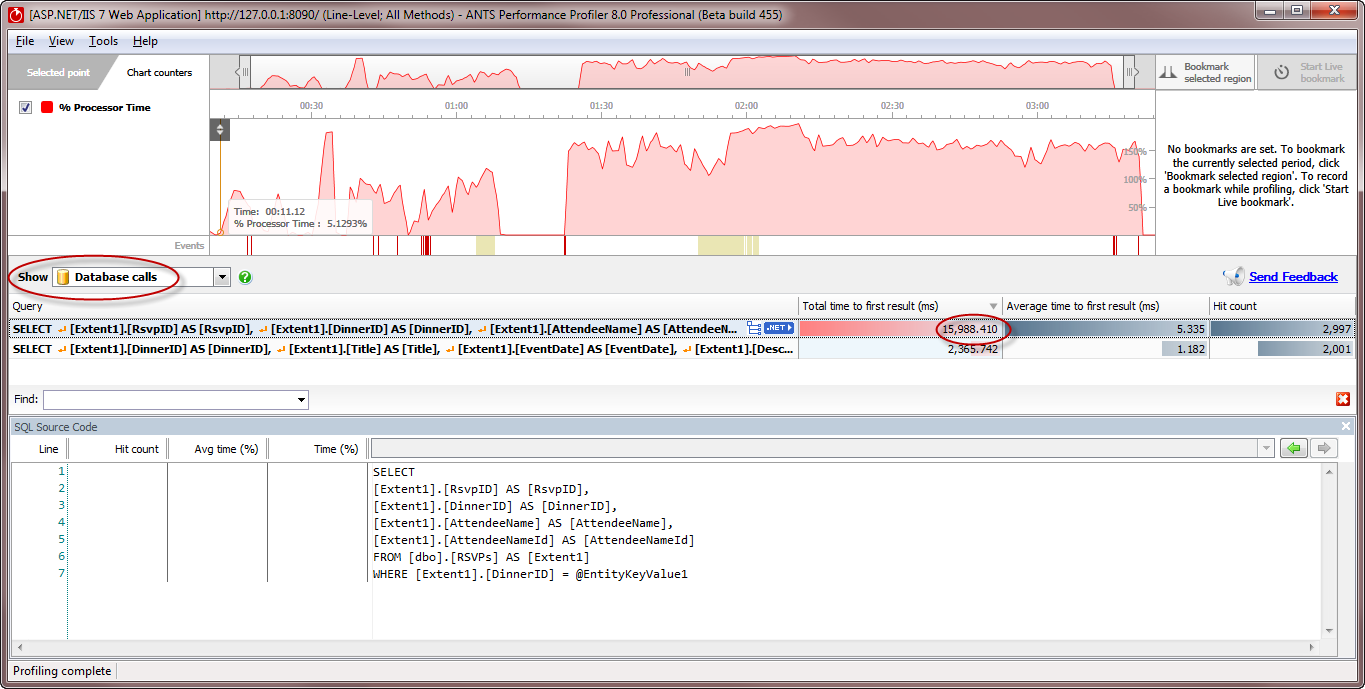
Again, it's clear that this very broad request is being run repeatedly, contributing a large total running time. It would be more efficient to run a more precise request fewer times.
For more on SQL query timings, see The database calls view.
After profiling, we now have a clear idea of which HTTP requests are associated with slow performance, and which of our .NET methods contain the source of those slowdowns. We know which methods to rewrite to remove bottlenecks, and the steps we'll need to reproduce in the application to check that the problem has gone.
This documentation contains proprietary information and is protected by copyright law.
Copyright © 2026 Red Gate Software Limited. All rights reserved


