Business value (ROI)
Published 29 September 2026
ENTERPRISE
Flyway Insights is in public preview for Flyway Enterprise users. Features may change before general availability. Got an idea or found a problem? Tell us what you think
The Business value (ROI) page shows how much time and money Flyway saves your team, so you can make the case to stakeholders. It starts with a prediction based on your team's numbers. Once you have 90 days of deployment data, it measures your actual savings and compares them with the prediction.
See the ROI at https://flyway.red-gate.com/roi.
Getting started
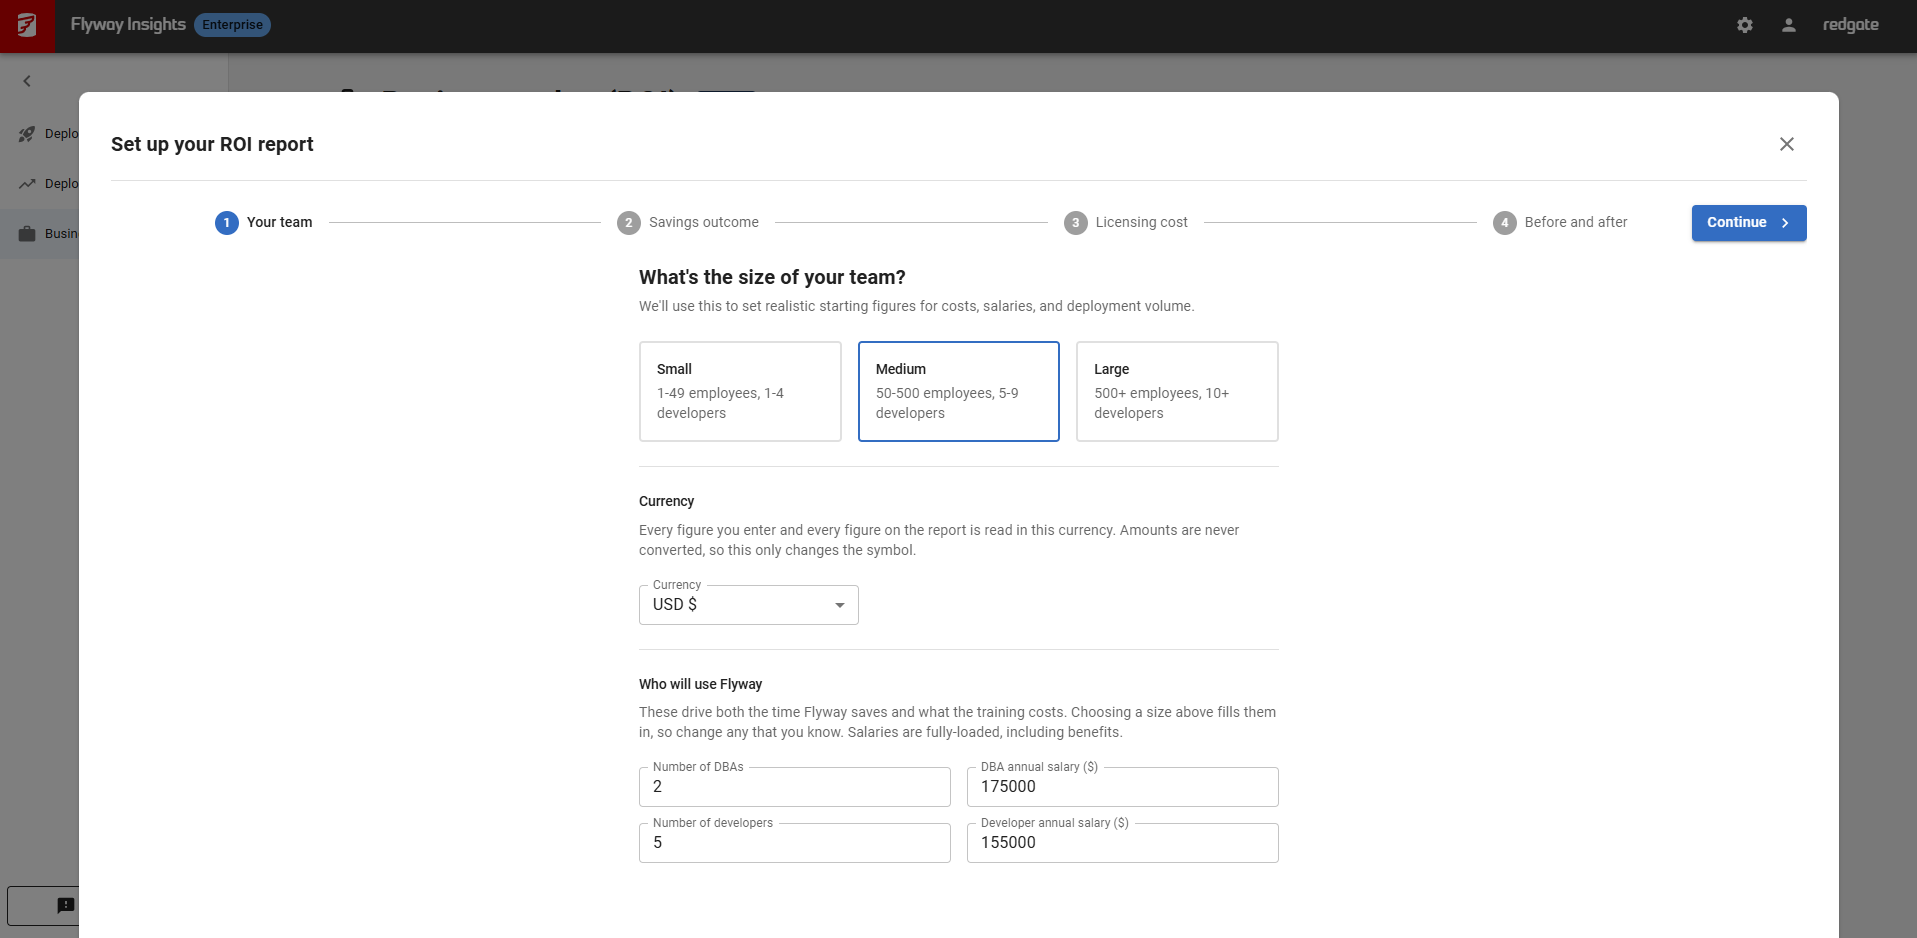
The first time you open the page, it says See what Flyway could save your team. Select Get started and answer a few questions:
- Team size: how many people work on database changes.
- Before and after: how often you deploy, how long changes take, and how often deployments fail, before Flyway and with Flyway.
- Savings outcome: what the saved time means for your team.
- License cost: your annual Flyway license cost and currency.
Industry defaults are provided if you don't have your own numbers yet.
Predicted and measured savings
What the page shows depends on how much deployment data you have. The banner at the top explains which figures you're looking at.
| Your data | What you see |
|---|---|
| No deployments yet | A prediction based on your numbers (or industry defaults): "Flyway is estimated to save your team … a year, paying for itself in …" |
| Less than 90 days of deployments | Still a prediction. The banner tells you when your measured savings will appear |
| 90 days or more | Measured savings from your last 90 days of deployments, compared with the prediction: "Flyway saved your team … last quarter, …% ahead of / below / in line with the … predicted." |
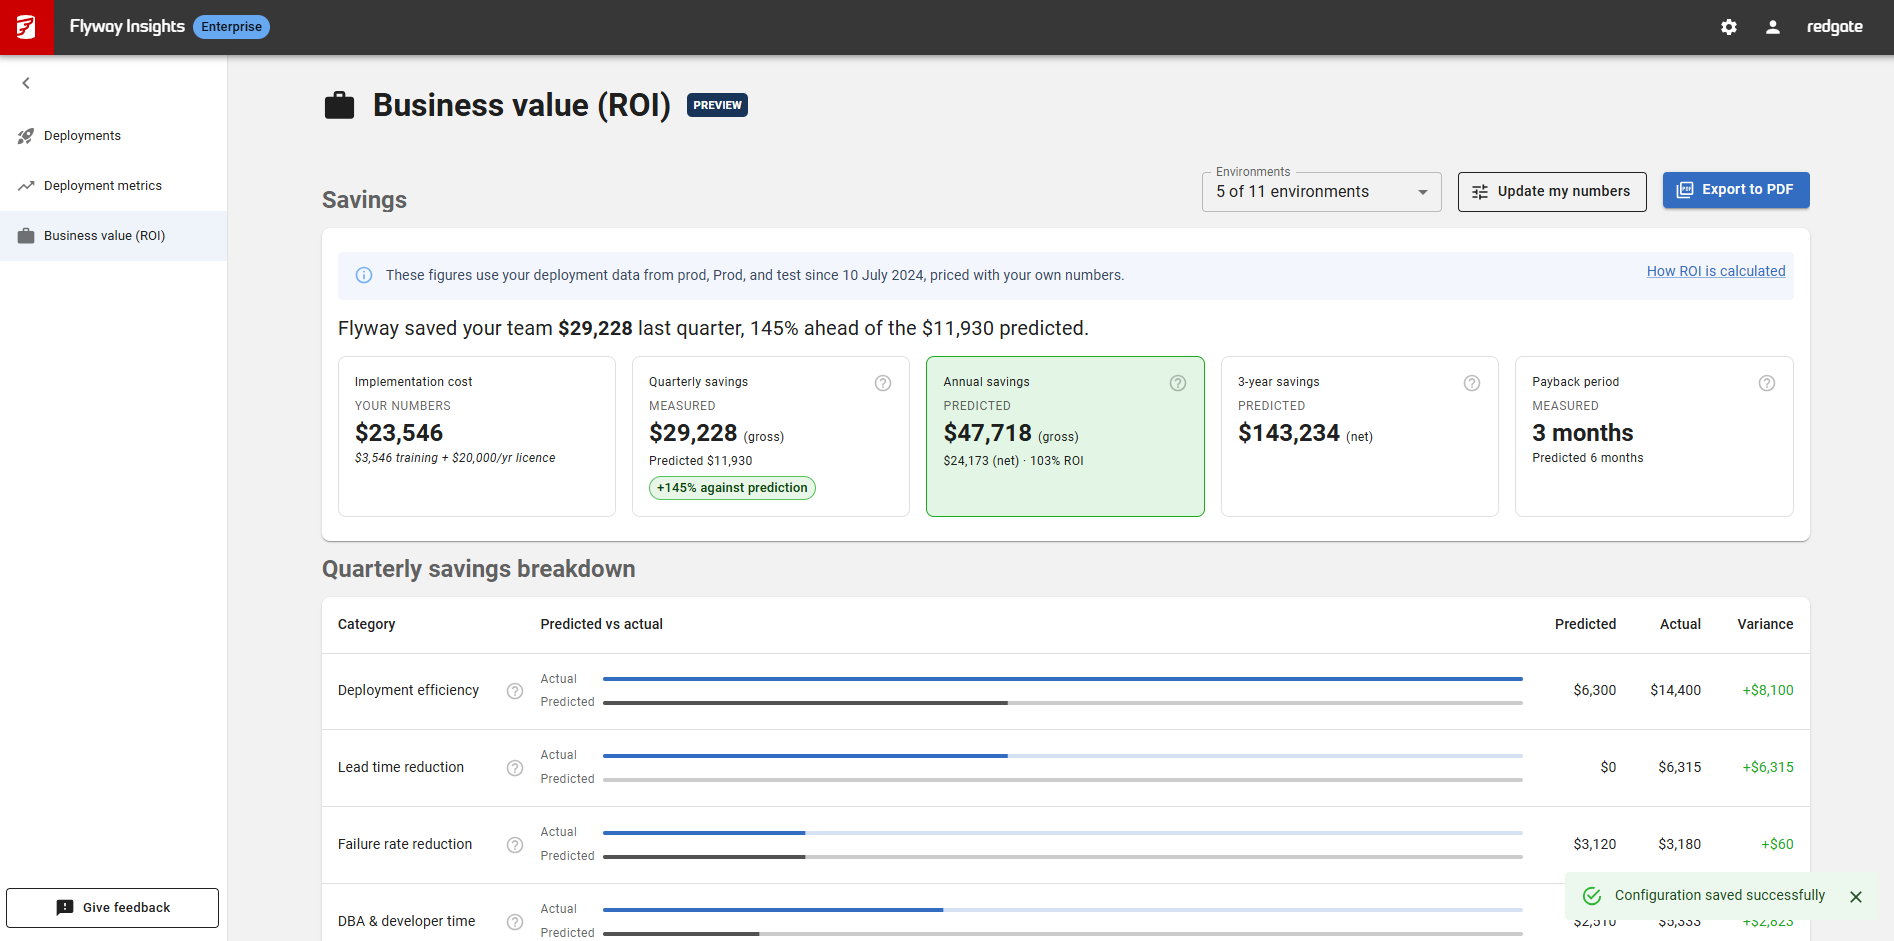
Each tile is labelled Your numbers, Predicted or Measured, so you always know where a figure came from. Measured tiles also show how they compare with the prediction.
The page also includes:
- Quarterly savings breakdown: savings from deployment efficiency, lead time reduction, failure rate reduction, and DBA and developer time. In the measured view, predicted and actual appear side by side.
- How Flyway compares: deployments per quarter, lead time and failure rate before Flyway, as expected with Flyway, and as actually measured.
Select How ROI is calculated to see the methodology.
Choosing environments
In the measured view, use Environments to choose which environments count. For example, measure production only. Your environments selection is reflected on the DORA metrics page. It is not shared with your Redgate Organization.
Measured savings use your own deployments plus those your colleagues have shared with your Redgate Organization. Your ROI inputs stay your own.
We're currently thinking about how we can let you categorize environments to make this easier (e.g, show all Prod across all projects without selecting each one individually). Contact the development team to discuss ideas around this.
Changing your numbers
Select Update my numbers to change your inputs:
- Flyway deployment values: the deployment frequency, lead time and failure rate you expect with Flyway.
- Your company: your team and costs.
- Predicted ROI: the preset and tuning values the prediction uses.
Your numbers are saved to your Redgate ID, so they're there next time you sign in.
Sharing the report
Select Export to PDF to download a copy of the report, including the environments the figures cover, to share with your team.
ROI Calculator Disclaimer
The ROI Calculator is a cost savings tool and only provides estimates of the potential cost savings. Such estimates are not a guarantee of cost savings and actual cost savings may differ. Redgate disclaims all warranties and liability for the ROI Calculator.
This documentation contains proprietary information and is protected by copyright law.
Copyright © 2026 Red Gate Software Limited. All rights reserved


