Integrate with Redgate Monitor
Published 16 November 2022
EDITION: ENTERPRISE
Redgate Monitor is a database monitoring and alerting solution for your entire estate (SQL Server, PostgreSQL, Oracle, MySQL, and MongoDB) whether that's on-premise, in the cloud, or both. For more information or to download, go to Redgate Monitor.
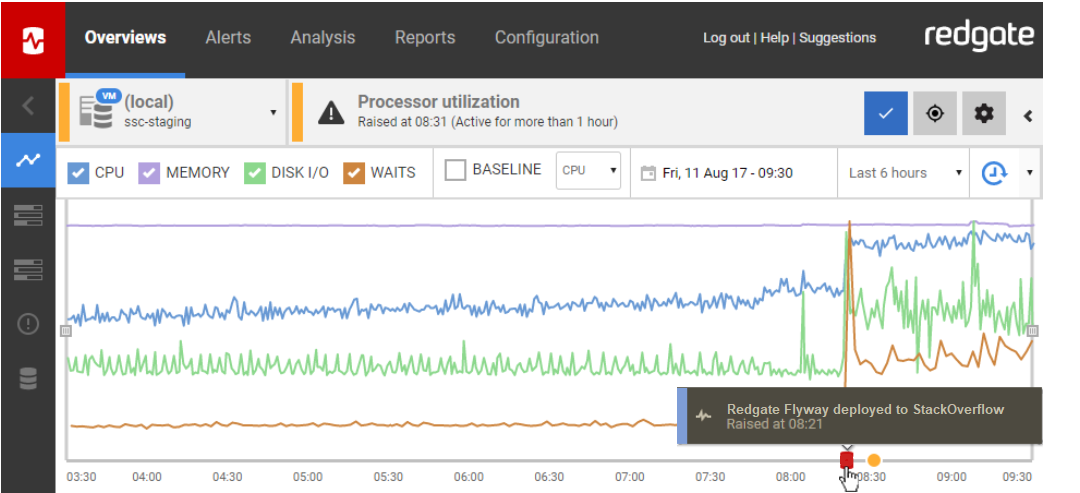
Redgate Monitor's activity graph displays CPU, Memory, I/O use, and waits over time. You can setup Flyway (using the instructions below) to annotate the graph with when database deployments happen. This can help teams understand the impact of a database release on the server and quickly get to the root of a problem.
Instructions for SQL Server or PostgreSQL
You can also use the Monitor API, which does not write to the error log. You can read more about this on this blog.
Instructions for SQL Server
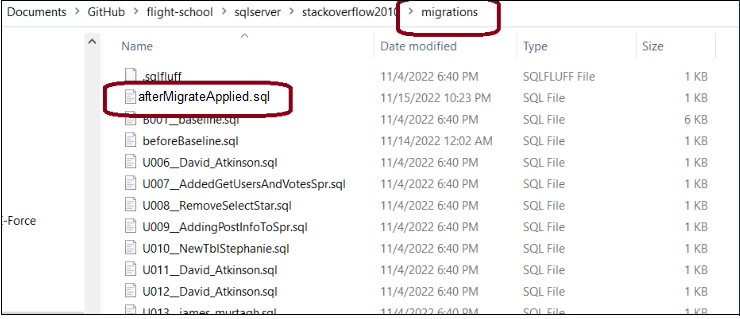
- Create a new file called afterMigrateApplied.sql in your migrations folder.
- Copy and paste the following code into this file.
- Save and commit/push to your repo.
|
The next time Flyway migrates a database, this event will be written to the SQL Server log and displayed on the Redgate Monitor activity graph.
afterMigrateApplied.sql
-- ---------------------------------------------------------------------
-- Annotate this release on Redgate Monitor
-- ---------------------------------------------------------------------
IF HAS_PERMS_BY_NAME(N'sys.xp_logevent', N'OBJECT', N'EXECUTE') = 1
BEGIN
    DECLARE @databaseName AS nvarchar(2048), @eventMessage AS nvarchar(2048)
    SET @databaseName = REPLACE(REPLACE(DB_NAME(), N'\', N'\\'), N'"', N'\"')
    SET @eventMessage = N'Redgate Flyway: { "deployment": { "description": "Flyway deployed to ' + @databaseName + N'", "database": "' + @databaseName + N'" }}'
    EXECUTE sys.xp_logevent 55000, @eventMessage
END
GO


