Current activity
Published 28 March 2024
Unavailable in Redgate Monitor SaaS
Redgate Monitor shows you which queries are running on supported instances in the current activity tab. The following instances are supported:
- SQL Server
- PostgreSQL
- OracleMySQL
This allows you to inspect your server activity in real time, giving you the ability to identify a problem query while it's still running or react even before the query finishes.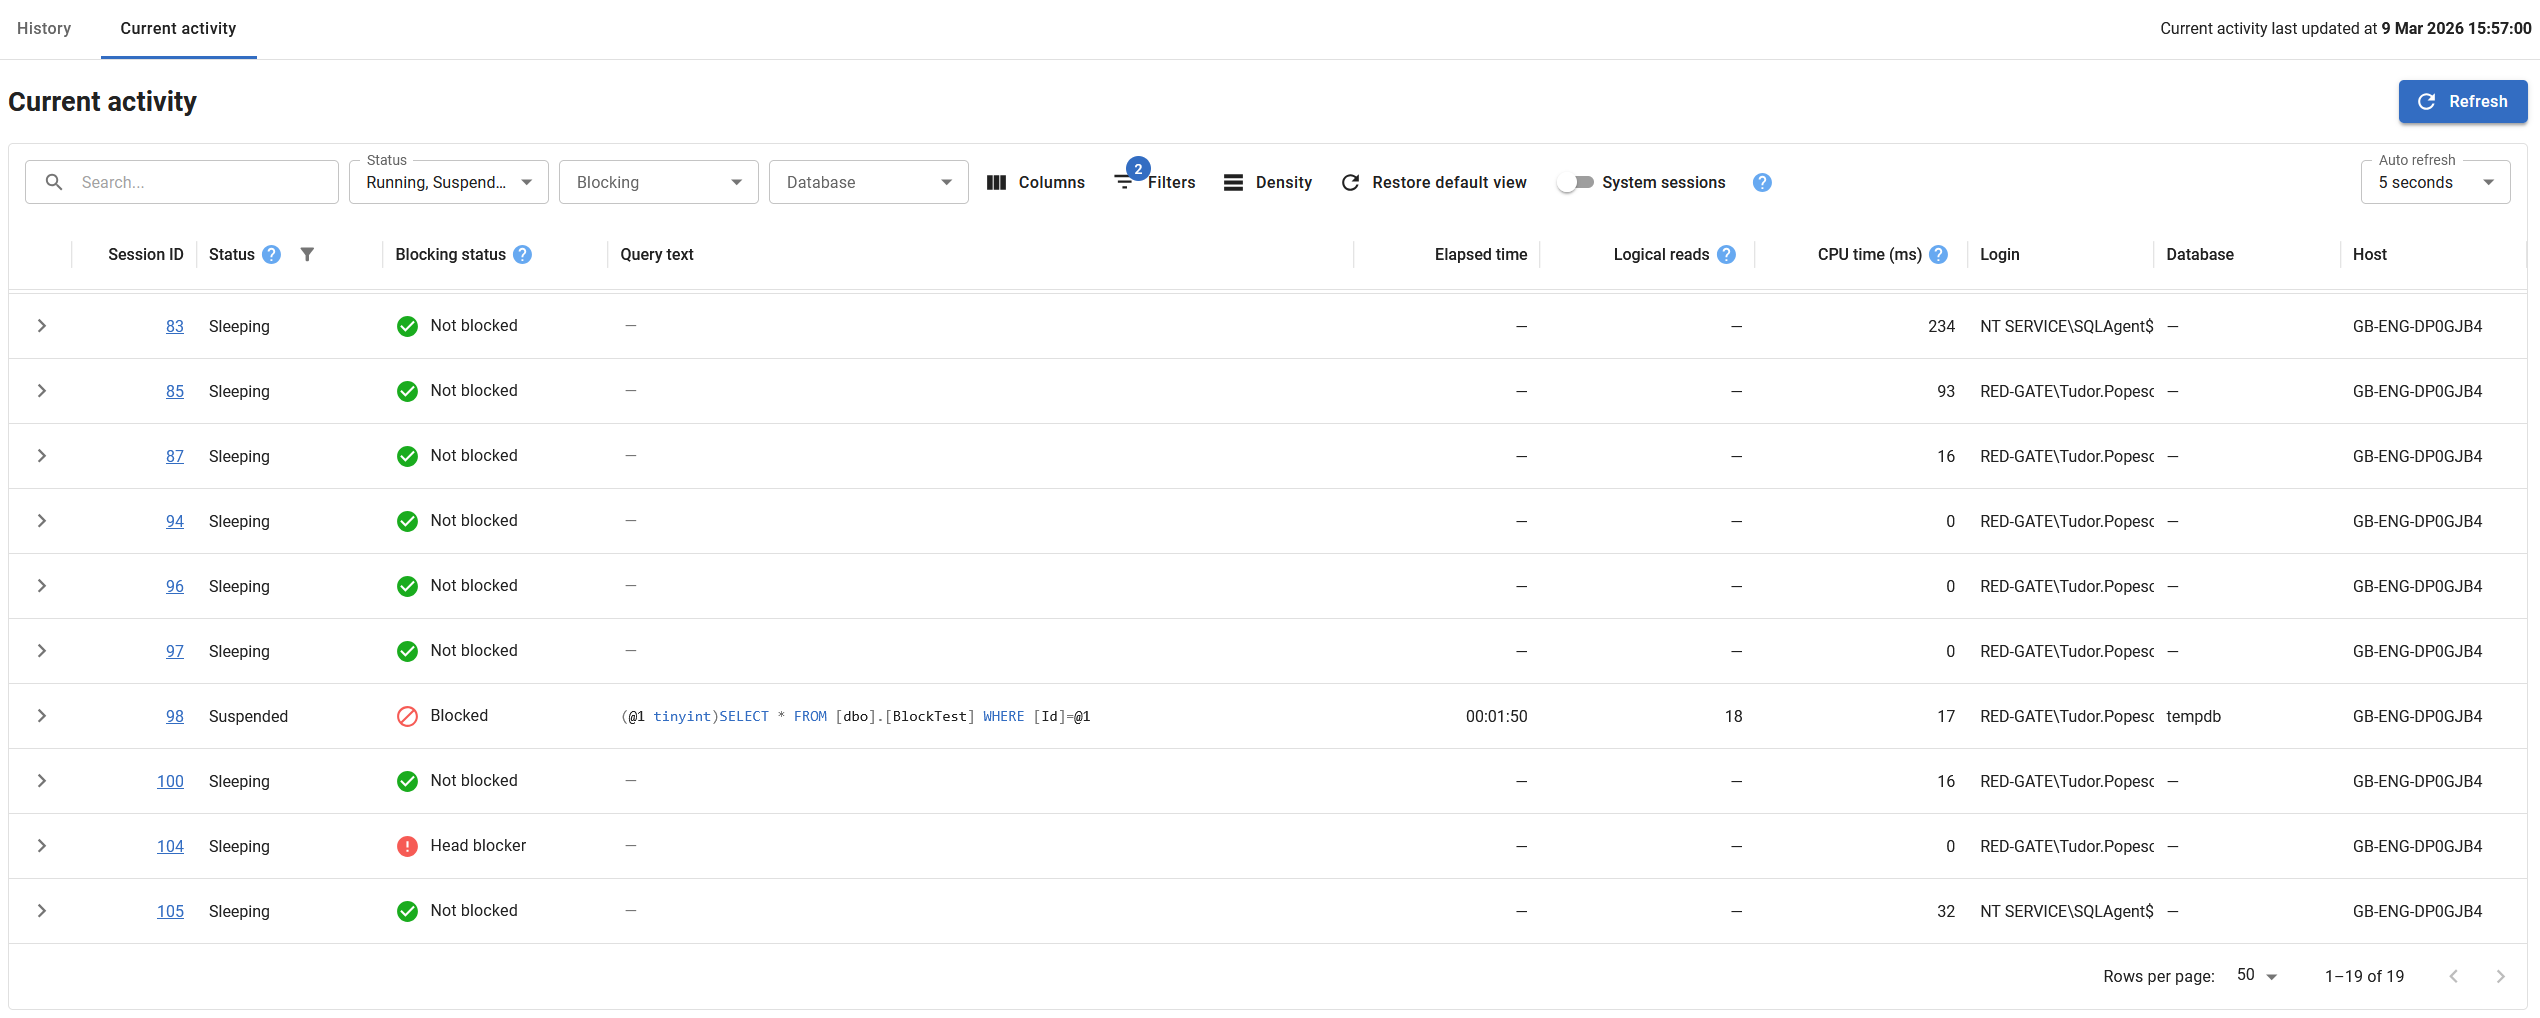
Refreshing the page
Redgate Monitor will collect the data when the current activity page loads. The exact time of the collection is shown in the top right corner of the page.
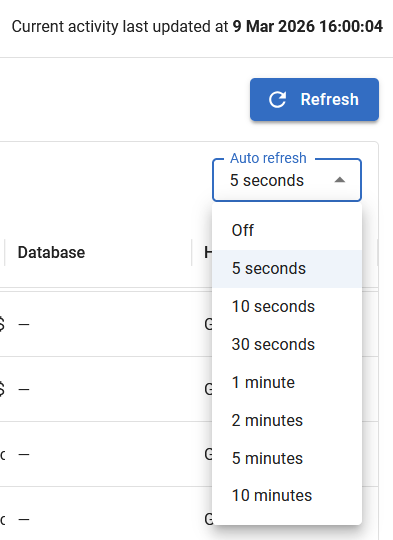
By default, the data on the page refreshes every 30 seconds. If you wish to refresh the data, you can do so in the following ways.
- Manual Refresh. This can be done by pressing the Refresh button. This is good for monitoring short queries you are triggering yourself.
- Auto refresh. By using the Auto refresh dropdown, you can change the refresh interval or disable it.
- Reloading the page via the browser. This is not recommended, as it is slower than the alternatives.
When a row is opened, auto refresh is temporarily disabled.
Filters
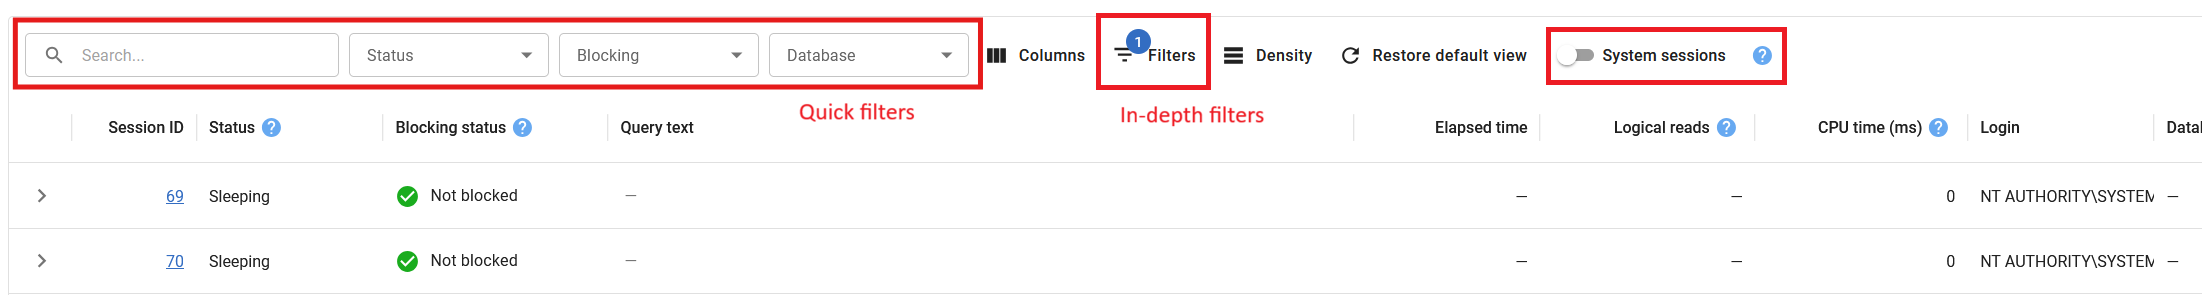
Filters are available to make it easier to find a particular query. You can change the filters in multiple ways:
- Perform a text search across all visible columns using the search box.
- Use quick dropdowns to filter by status, blocking, or database.
- Modify and view all available columns via the in-depth filters menu.
- Quickly toggle the visibility of system sessions.
Available data
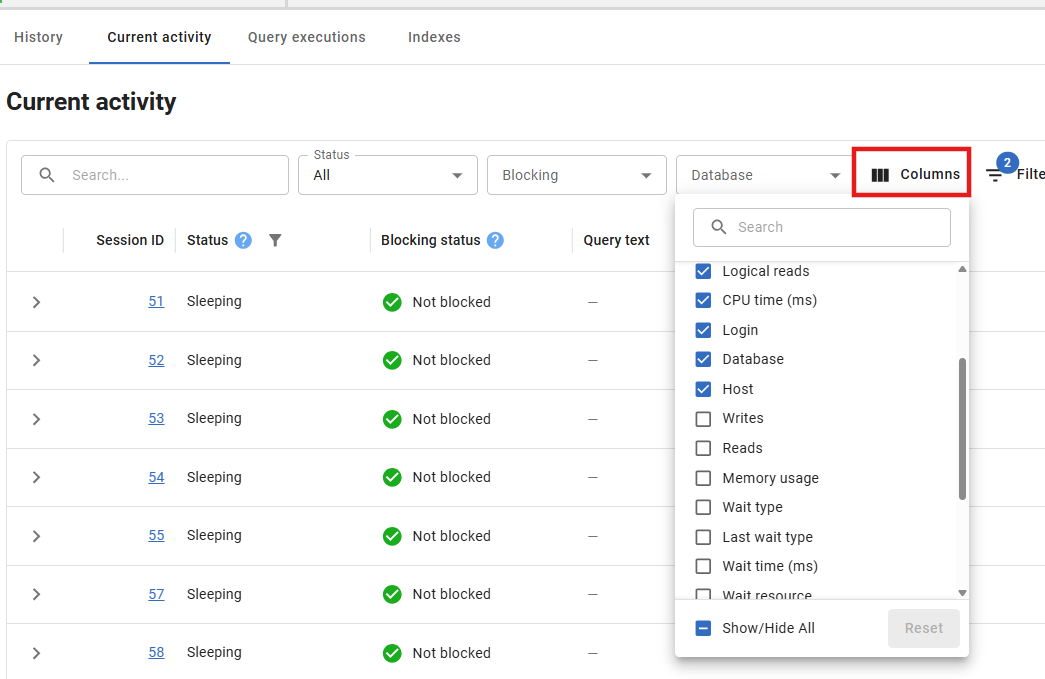
The current activity page has various data columns, depending on the instance type. Not all column are visible by default. For example, CPU and memory usage statistics are available for SQL Server instances but may not be displayed by default.
Explore all available data for an instance type by using the Columns menu in the toolbar and selecting which columns to show/hide.
Query details
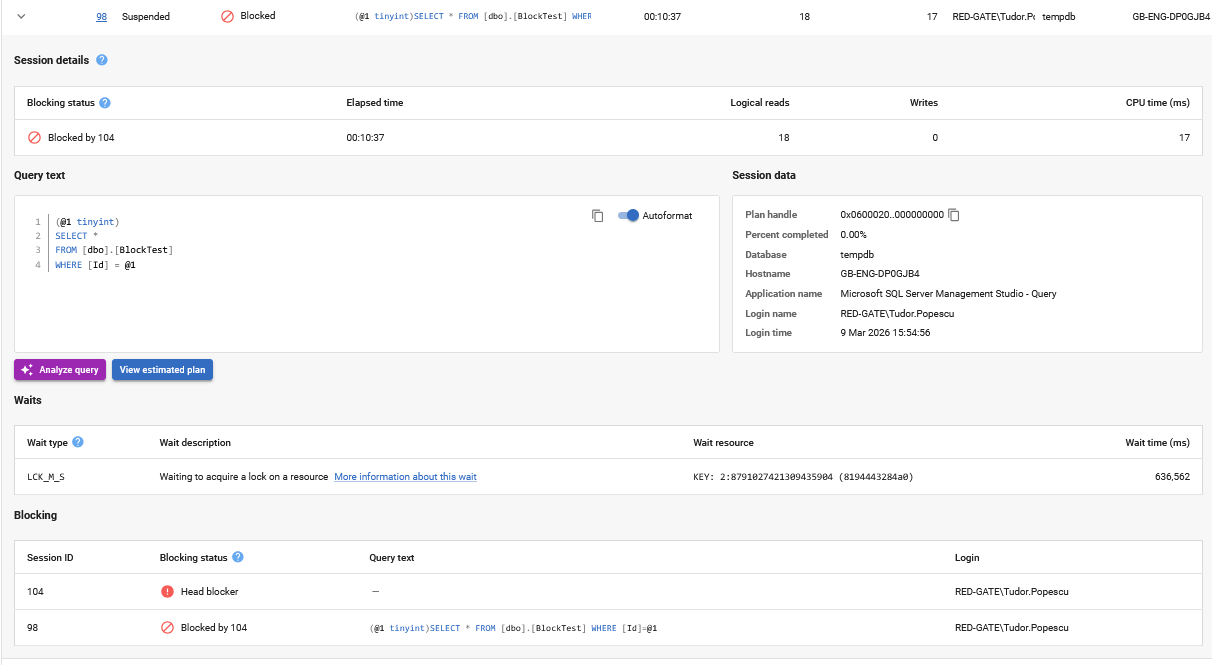
You can expand a row to show the Query Details. This includes additional details for previous statistics, blocking information, wait details, and buttons to view the query plan or perform AI query analysis.
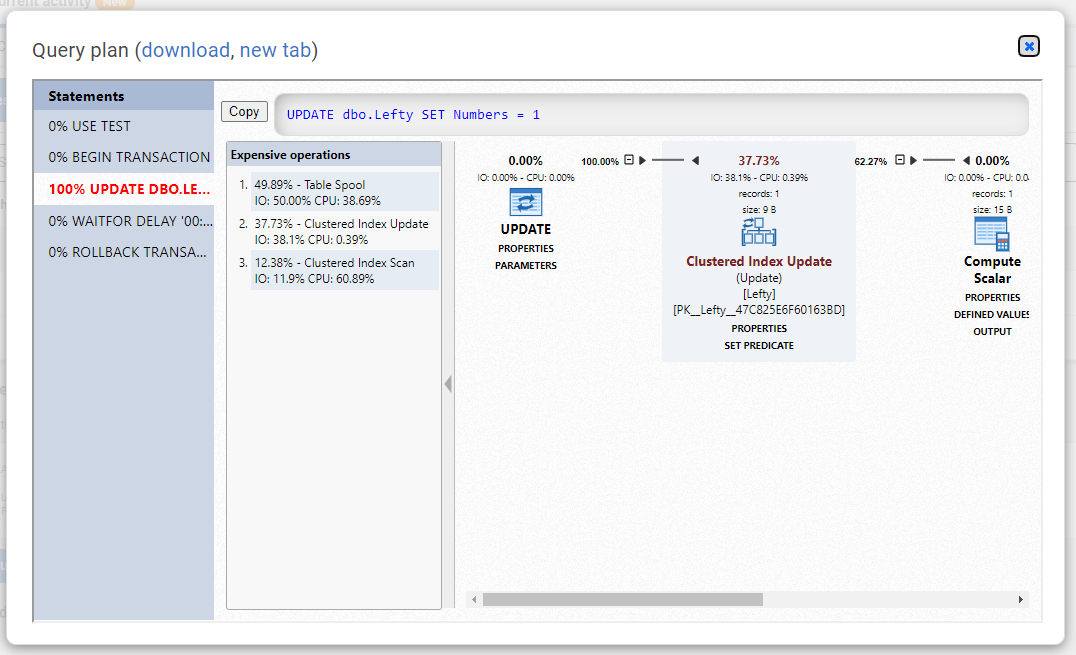
The View query plan button allows you to view the query plan in the browser and download it if you so chose.
On the main table you can identify the head blocker immediately with the blocking status column and expand the row to see the full blocking tree in the blocking section.
The data shown on the table are collected from sys.dm_exec_sessions and sys.dm_exec_requests dynamic management objects. Unlike other sections, it is displayed without being saved to Redgate Monitor Repository, this means once the page is reloaded you will lose the data shown on the page.
This documentation contains proprietary information and is protected by copyright law.
Copyright © 2026 Red Gate Software Limited. All rights reserved


