Custom metrics and alerts
Published 28 March 2024
Use the Custom Metrics page to fine-tune the monitoring strategy for the specific needs of your applications and servers. The queries in a custom metric run using the user account Redgate Monitor is configured to connect with, and Redgate Monitor does not restrict what they can do. See Custom metrics and permissions.
What is a custom metric?
By default, Redgate Monitor collects a standard set of Machine, SQL Server and Database metrics from every monitored object. It does so by running a T-SQL query against the objects at regular intervals and displaying the collected values as data points on the Analysis page.
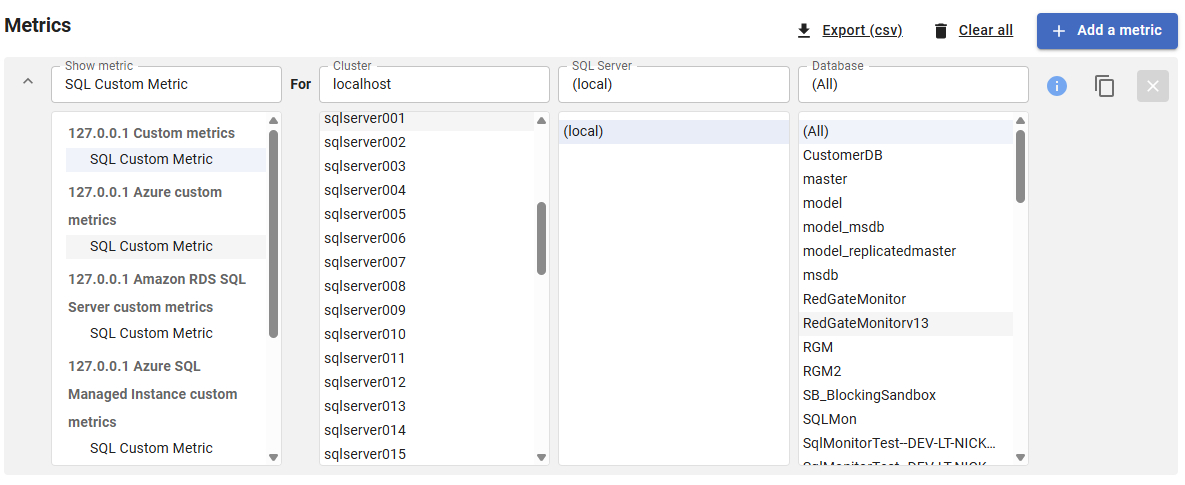
Custom metrics are different. You add your own T-SQL query, choose the instances and databases to collect from, and specify the frequency of collection. This means data unique to your server environment can be collected and analyzed. Each time the query runs, a single numeric value is collected. Values are displayed as data points on the Analysis page when you select a custom metric from the Show drop-down list:
What is a custom alert?
A custom alert warns you when a custom metric value passes a specified threshold for a certain duration. Adding a custom alert is optional, but it is a useful way of finding out if the values collected by a custom metric suggest problems with your databases.
Custom alerts are Continuous alerts that are raised at a defined level (Low, Medium or High). They can have the following status:
- Active: the issue that triggered the alert is still a problem.
- Ended: the issue has been resolved.
You can configure multiple thresholds so that, if the collected metric value changes, the Active alert will automatically escalate or downgrade from the threshold level at which it was raised.
Once created, the custom alert behaves just like the alerts provided by default and displayed in the Alert Inbox or the Alert settings page (Configuration > Alert settings).
Enabling custom metrics
Custom metrics are disabled by default at the feature flag level.
If your installation already has custom metrics, they continue to work after upgrading. You do not need to do anything, and you can carry on creating and editing metrics as before. Custom metrics are only turned off on installations that have never used them.
In order to enable custom metrics, you need to enable the CustomMetricExecution feature flag. You can do this by setting the environment variable SQLMONITOR_CustomMetricExecution to 1 on the web service server.
To make the change take effect, restart the Redgate Monitor Web service.
Before enabling custom metrics, read Custom metrics and permissions and check that Monitor connects to your servers with a login that has only the permissions it needs.
Note that if you delete every custom metric on an installation, custom metrics become disabled again, and you will need to set the feature flag before you can create a new one.
Next steps
This documentation contains proprietary information and is protected by copyright law.
Copyright © 2026 Red Gate Software Limited. All rights reserved


