MongoDb Server Overview
Published 19 January 2026
The MongoDB server overview provides comprehensive visibility into:
- Infrastructure health through CPU, memory, and disk metrics
- Query performance to identify optimization opportunities
- Database activity via instance metrics tracking connections, operations, and cache efficiency
- System stability through error logs and assertion monitoring
Regular monitoring of these metrics helps maintain optimal MongoDB performance, prevent resource exhaustion, and quickly diagnose issues before they impact applications or users.
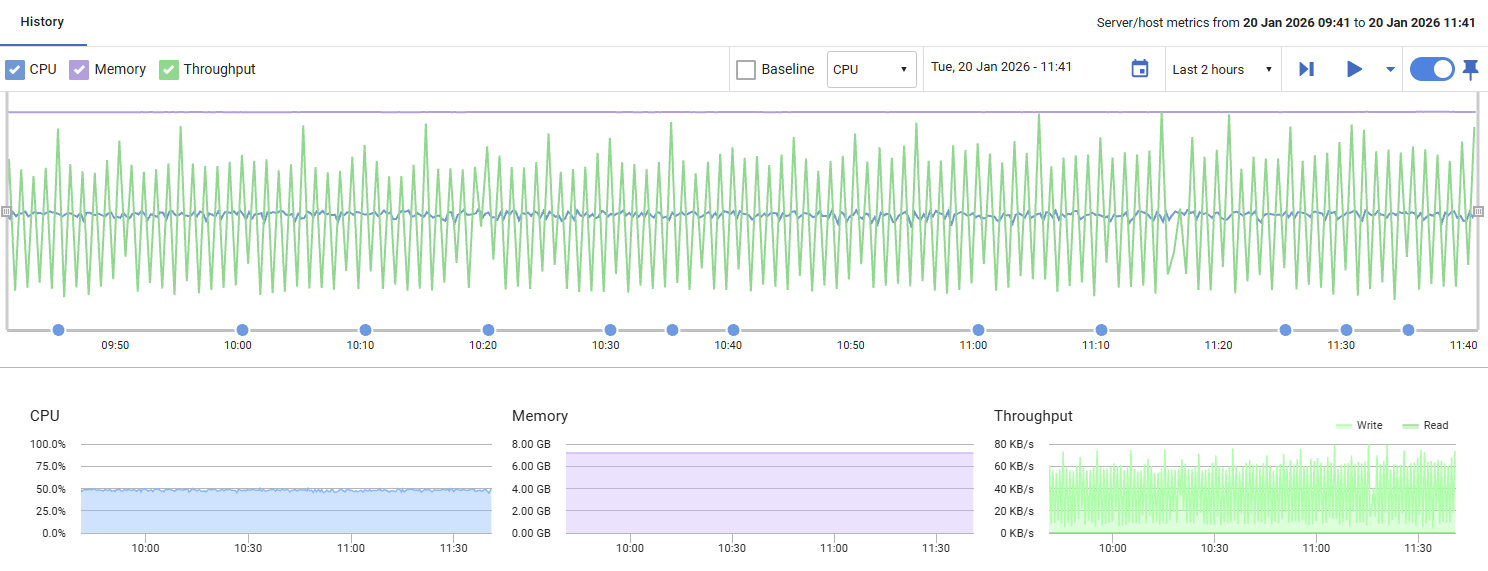
Server/Host Metrics
CPU
Displays the percentage of processor time being used by the host machine. Values range from 0% to 100%, with higher values indicating increased processor workload.
Memory
Shows the amount of memory currently in use by the host machine, displayed relative to total available capacity. This helps you monitor memory consumption and identify potential resource constraints.
Throughput
Displays disk I/O activity, showing read and write operations in bytes per second. This metric helps you track the volume of data being transferred to and from disk storage.
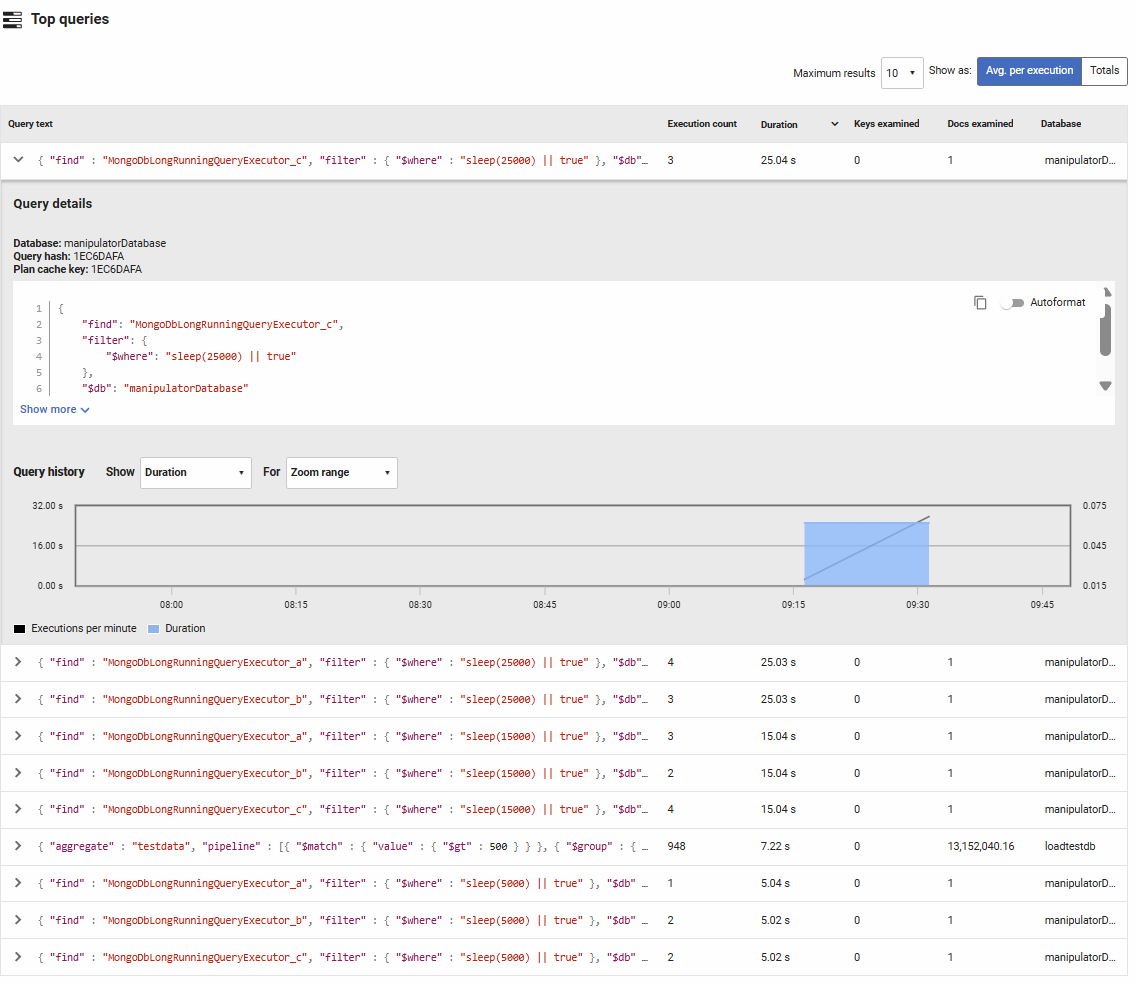
Top Queries
Lists the most frequently executed or resource-intensive queries based on execution count, duration, keys examined, and documents examined. You can toggle between viewing total values or averages per execution, and sort by any column to identify problematic queries.
Columns displayed:
- Query text: The MongoDB query in JSON format. Click to expand for full details and execution history.
- Execution count: The number of times this query pattern was executed during the selected time period.
- Duration: The total or average time spent executing this query. High duration values indicate slow queries that may need optimization.
- Keys examined: The number of index entries scanned. Comparing this to documents examined helps identify whether indexes are being used efficiently.
- Docs examined: The number of documents scanned to satisfy the query. High values relative to returned results suggest missing or inefficient indexes.
- Database: The database where the query was executed.
How to use this information:
Queries with high execution counts but short durations may benefit from caching strategies. Queries examining many more documents than keys suggest collection scans rather than index usage—consider adding appropriate indexes. Expanding a query reveals execution patterns over time and detailed performance metrics to guide optimization efforts.
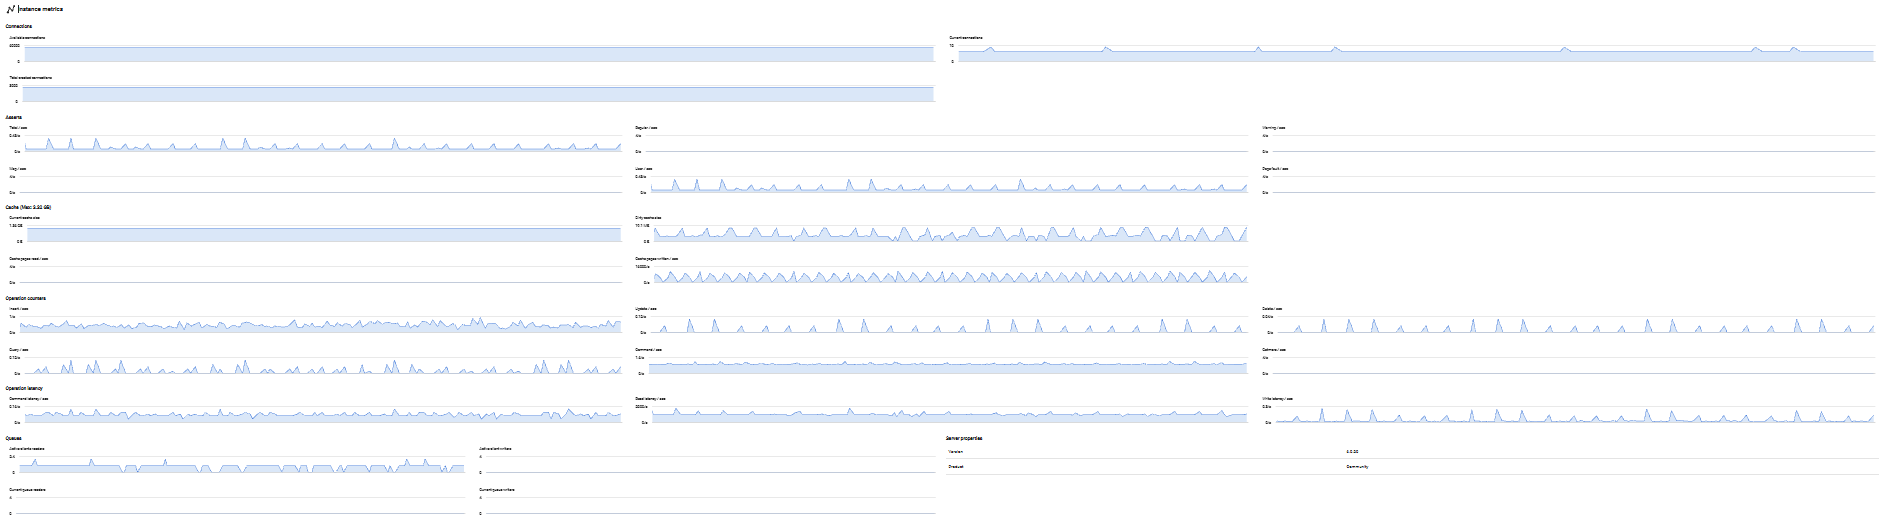
Instance Metrics
Provides detailed performance metrics specific to the MongoDB instance, helping you monitor database activity, connection patterns, and cache efficiency.
Connections
Tracks MongoDB connection activity:
- Available connections: The number of unused incoming connections available. If this approaches zero, you may need to increase the connection pool size or investigate connection leaks.
- Current connections: The number of active client connections to the database. Monitor for unexpected spikes that may indicate application issues or connection pooling problems.
- Total created connections: The cumulative count of all connections created since server startup. A rapidly increasing value suggests frequent connection churn rather than effective connection pooling.
Asserts
Monitors various assertion types that indicate potential issues:
- Total asserts per second: The overall rate of all assertion types.
- Regular asserts per second: Standard assertions triggered by normal error conditions.
- Warning asserts per second: Non-critical warnings that may indicate suboptimal conditions.
- Msg asserts per second: Informational messages about unusual but recoverable conditions.
- User asserts per second: Assertions triggered by user operations, such as duplicate key violations or schema validation failures.
- Page faults per second: The rate at which MongoDB accesses data not currently in memory, requiring disk reads. High values indicate memory pressure and potential performance degradation.
Regular occurrences of asserts should be investigated as they may indicate application errors, data quality issues, or insufficient resources.
Cache
Displays WiredTiger cache performance metrics:
- Current cache size: The amount of data currently held in the WiredTiger cache. Compare this to the maximum cache size to understand memory utilization.
- Dirty cache size: The amount of modified data in cache waiting to be written to disk. Large values may indicate write-heavy workloads or checkpoint delays.
- Cache pages reads per second: The rate at which pages are read into cache from disk. High values suggest the cache is too small for the working set.
- Cache pages written per second: The rate at which dirty pages are written from cache to disk. Spikes may correlate with checkpoint operations.
The cache section header displays the maximum cache size for reference. Effective cache utilization is critical for MongoDB performance—most of your working set should fit in cache to avoid frequent disk I/O.
Operation Counters
Tracks the rate of different database operations:
- Insert count per second: The rate of document insertions.
- Update count per second: The rate of document updates.
- Delete count per second: The rate of document deletions.
- Query count per second: The rate of query operations (find commands).
- Command count per second: The rate of database commands executed (excluding CRUD operations).
- GetMore count per second: The rate of cursor getMore operations, indicating result set pagination activity.
These metrics help you understand your application's workload pattern and identify changes in usage that may require capacity planning or optimization.
Operation Latency
Measures the time spent on different operation types:
- Command latency per second: Average latency for database commands.
- Read latency per second: Average latency for read operations. Increasing values may indicate disk performance issues, cache misses, or query inefficiency.
- Write latency per second: Average latency for write operations. Rising write latency may suggest disk bottlenecks, replication lag, or lock contention.
Monitor latency trends to ensure consistent performance and quickly identify degradation before it impacts users.
Queues
Displays active operations and queued operations waiting for resources:
- Active clients readers: The number of clients currently performing read operations.
- Active clients writers: The number of clients currently performing write operations.
- Current queue readers: The number of read operations waiting for locks. Non-zero values indicate read contention.
- Current queue writers: The number of write operations waiting for locks. Non-zero values indicate write contention and potential performance bottlenecks.
High queue values suggest lock contention or resource saturation. Investigate long-running operations, add indexes to reduce lock duration, or consider sharding to distribute load.
Server Properties
Displays MongoDB instance configuration details:
- Version: The MongoDB server version number (e.g., 6.0.3, 7.0.5), important for tracking features, bug fixes, and compatibility.
- Product: The MongoDB edition (Community or Enterprise), which determines available features like auditing, encryption at rest, and LDAP authentication.
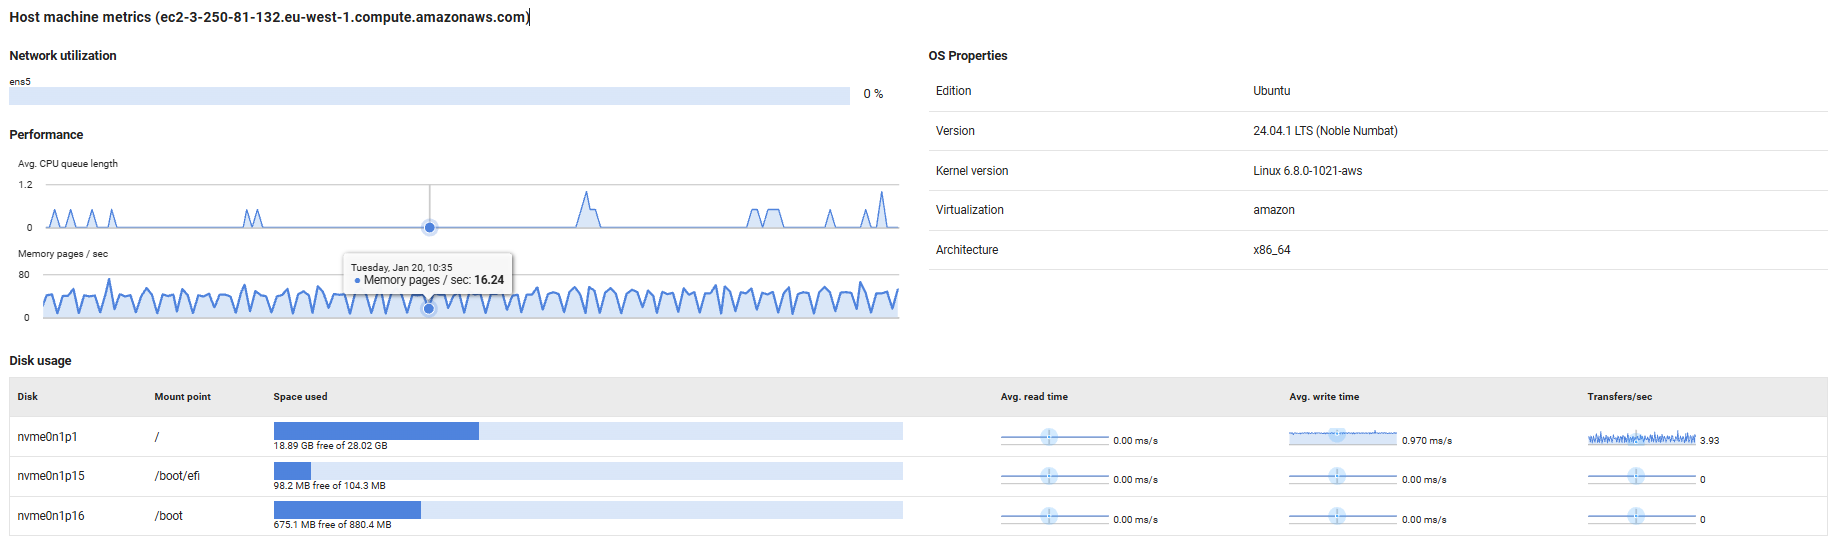
Host Machine Metrics
Provides visibility into the physical or virtual host server's resource utilization and configuration, helping you monitor the infrastructure layer supporting your MongoDB instance.
Network Utilization
Displays the current network bandwidth usage as a percentage for each network interface on the host machine. High utilization rates (typically above 80%) may indicate network saturation, which can lead to slow query response times, replication delays, or connectivity issues for database clients.
Performance
Tracks key host-level performance indicators:
- Avg. CPU queue length: Shows the average number of threads waiting for CPU time. Values consistently above 2-4 (depending on CPU core count) indicate the host is CPU-bound, which can slow down database operations.
- Memory pages/sec: Measures the rate at which the operating system is reading from or writing to the page file (virtual memory on disk). High values indicate memory pressure, forcing the OS to swap memory contents to disk, which severely degrades database performance. This should remain close to zero for optimal performance.
OS Properties
Displays operating system configuration details:
- For Linux hosts: Shows the distribution edition (e.g., Ubuntu, Red Hat Enterprise Linux), OS version, kernel version, virtualization technology (if applicable, such as KVM or VMware), and architecture (e.g., x86_64, ARM64).
- For Windows hosts: Shows the Windows edition, version number, and build number.
This information is useful for compatibility verification, patch management, and troubleshooting OS-specific issues.
Disk Usage
Provides detailed disk performance and capacity metrics:
- Space used: Visual bar chart showing used versus free disk space. Monitor this to prevent running out of space, which can cause MongoDB crashes or prevent write operations.
- Avg. read/write time: Sparkline graphs displaying average disk read and write latency over time. Increasing latency values indicate disk performance degradation, which directly impacts query performance and data persistence.
- Transfers/sec: Shows the rate of disk I/O operations. High transfer rates combined with high latency suggest the disk subsystem is overloaded and may benefit from faster storage (e.g., SSDs) or load balancing across multiple volumes.
Note: Throughput metrics are not available for mapped network drives.
Error Log
Displays recent errors and warnings from MongoDB's global log, filtered to show only Fatal (F), Error (E), and Warning (W) severity messages during the selected time period. This section helps you quickly identify and diagnose database issues.
Columns displayed:
- Log date: When the log entry was created.
- Id: The unique message identifier for this log entry type, useful for searching MongoDB documentation.
- Context: The MongoDB context or operation that generated the message (e.g., conn123 for a connection, replication for replication operations).
- Severity: The log level code (F=Fatal, E=Error, W=Warning).
- Component: The MongoDB component responsible for the message (e.g., STORAGE, REPL, NETWORK, COMMAND).
- Message: The log message describing the event or issue.
- Attributes: Additional structured data providing context, such as connection details, operation parameters, error codes, or affected collections.
Common issues to monitor:
- Authentication failures: Repeated authentication errors may indicate security issues or misconfigured applications.
- Replication lag warnings: Messages from the REPL component about replication delays or sync source issues.
- Storage errors: STORAGE component messages about disk space, corruption, or WiredTiger issues.
- Connection problems: NETWORK component errors about failed connections, timeouts, or SSL/TLS issues.
- Query timeouts: Operations exceeding execution time limits, suggesting missing indexes or inefficient queries.
Use this section to proactively identify problems before they escalate. The structured attributes provide valuable context for troubleshooting and correlating issues with application behavior or infrastructure changes.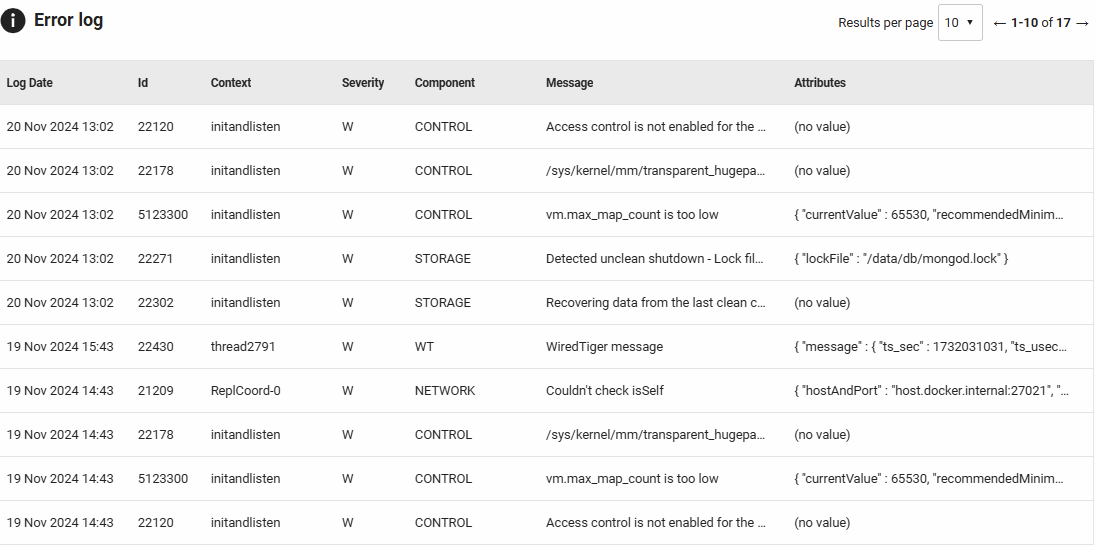
This documentation contains proprietary information and is protected by copyright law.
Copyright © 2026 Red Gate Software Limited. All rights reserved


