MySQL Server Overview
Published 19 January 2026
The MySQL server overview provides comprehensive visibility into:
- Infrastructure health through CPU, memory, and disk metrics
- Query performance to identify optimization opportunities and indexing needs
- Database activity via instance metrics tracking connections, transactions, and InnoDB performance
- System stability through error logs and query error monitoring
Regular monitoring of these metrics helps maintain optimal MySQL performance, prevent resource exhaustion, identify missing indexes, and quickly diagnose issues before they impact applications or users. Pay special attention to the InnoDB buffer pool hit ratio, full table scans, and error logs as key indicators of database health.
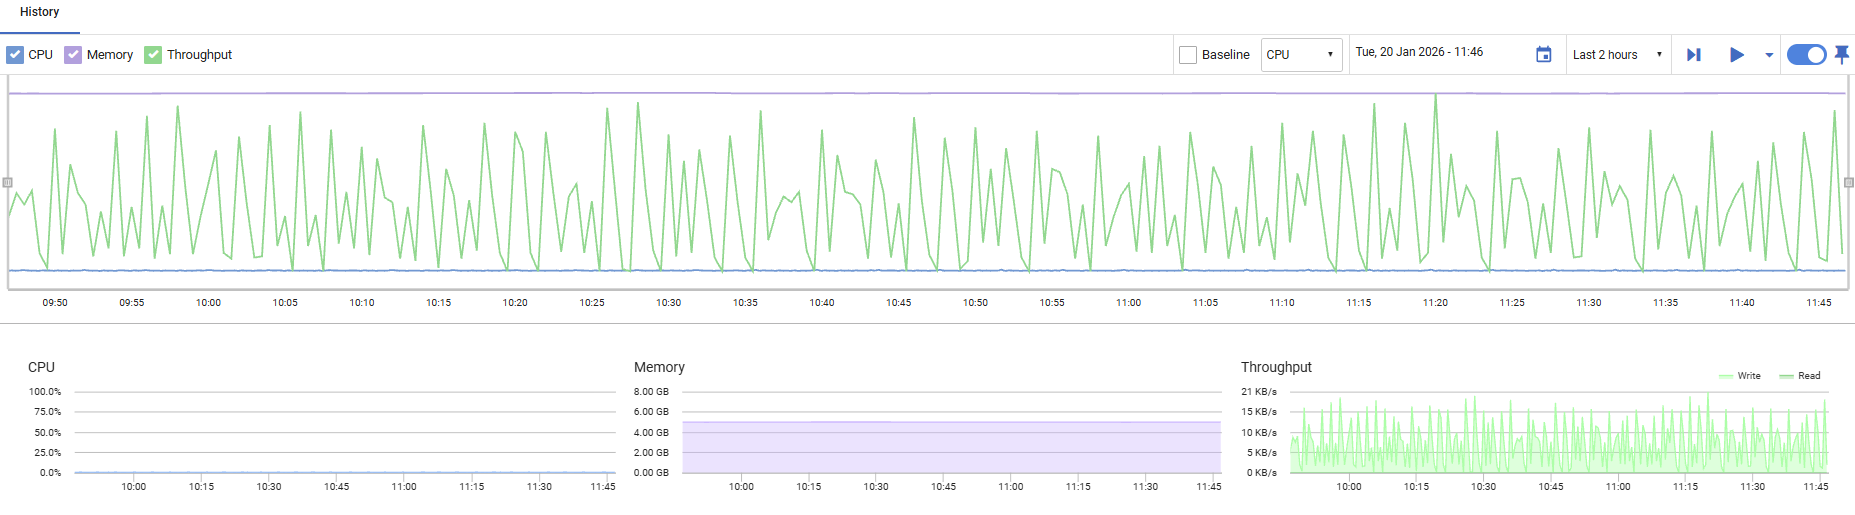
Server/Host Metrics
CPU
Displays the percentage of processor time being used by the host machine. Values range from 0% to 100%, with higher values indicating increased processor workload.
Memory
Shows the amount of memory currently in use by the host machine, displayed relative to total available capacity. This helps you monitor memory consumption and identify potential resource constraints.
Throughput
Displays disk I/O activity, showing read and write operations in bytes per second. This metric helps you track the volume of data being transferred to and from disk storage.
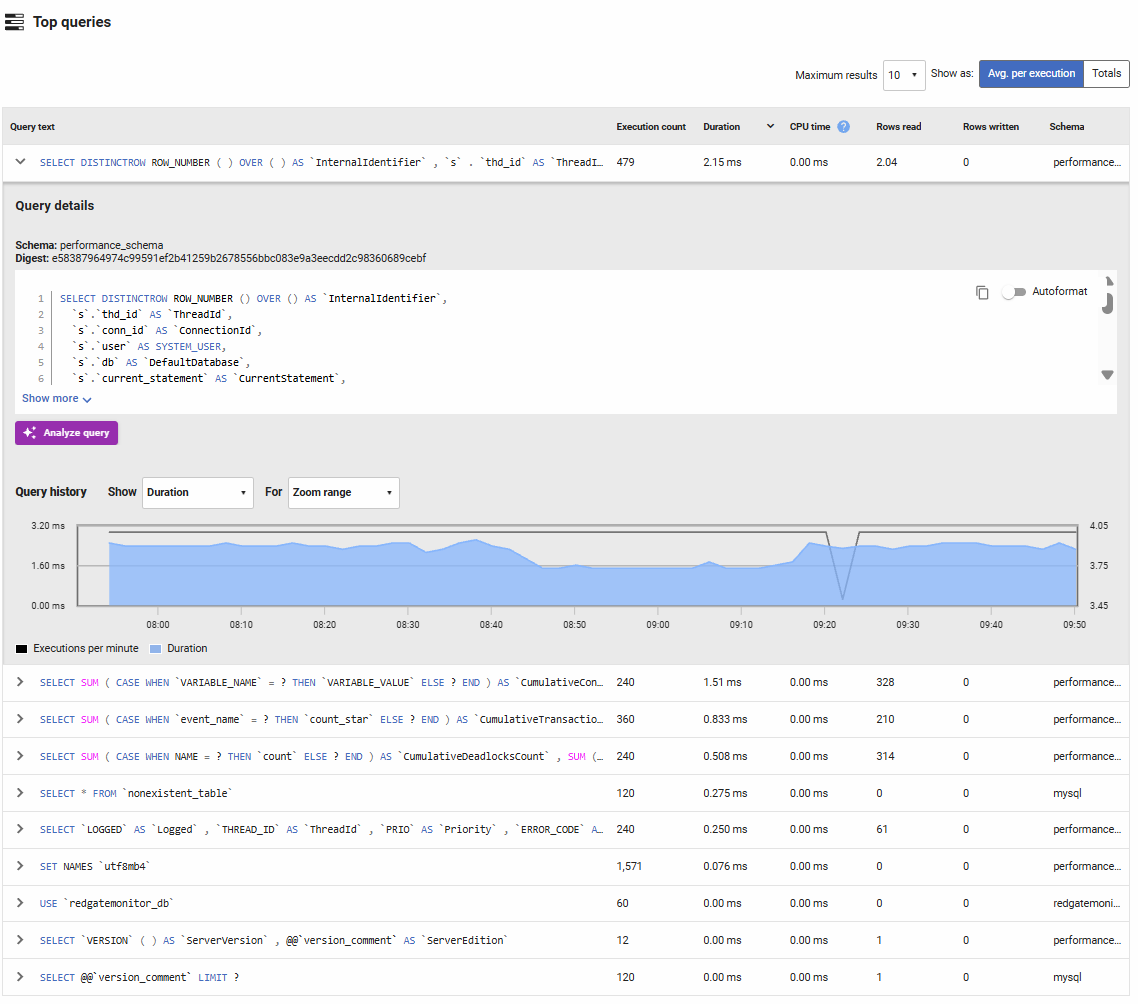
Top Queries
Lists the most frequently executed or resource-intensive queries based on execution count, duration, CPU time, and rows affected. You can toggle between viewing total values or averages per execution, and sort by any column to identify problematic queries.
Columns displayed:
- Query text: The SQL query statement. Click to expand for full details and execution history.
- Execution count: The number of times this query pattern was executed during the selected time period.
- Duration: The total or average time spent executing this query, including waiting for locks and I/O. High duration values indicate slow queries that need optimization.
- CPU time: The amount of CPU time consumed by the query. Queries with high CPU time relative to duration may be computation-intensive and could benefit from query optimization or result caching.
- Rows read: The number of rows examined to satisfy the query. High values suggest table scans or inefficient indexes.
- Rows written: The number of rows modified (inserted, updated, or deleted) by the query.
- Schema: The database schema where the query was executed.
How to use this information:
Compare rows read to rows returned—if a query reads millions of rows but returns only a few, it likely needs better indexing. High execution counts with moderate duration suggest candidates for caching or query result optimization. Queries with high CPU time may benefit from rewriting to reduce computation or use more efficient operations. Expanding a query reveals detailed metrics and execution history over time to guide your optimization efforts. The Analyze query button provides an AI assistant to review the query and suggest improvements, click here to view the documentation
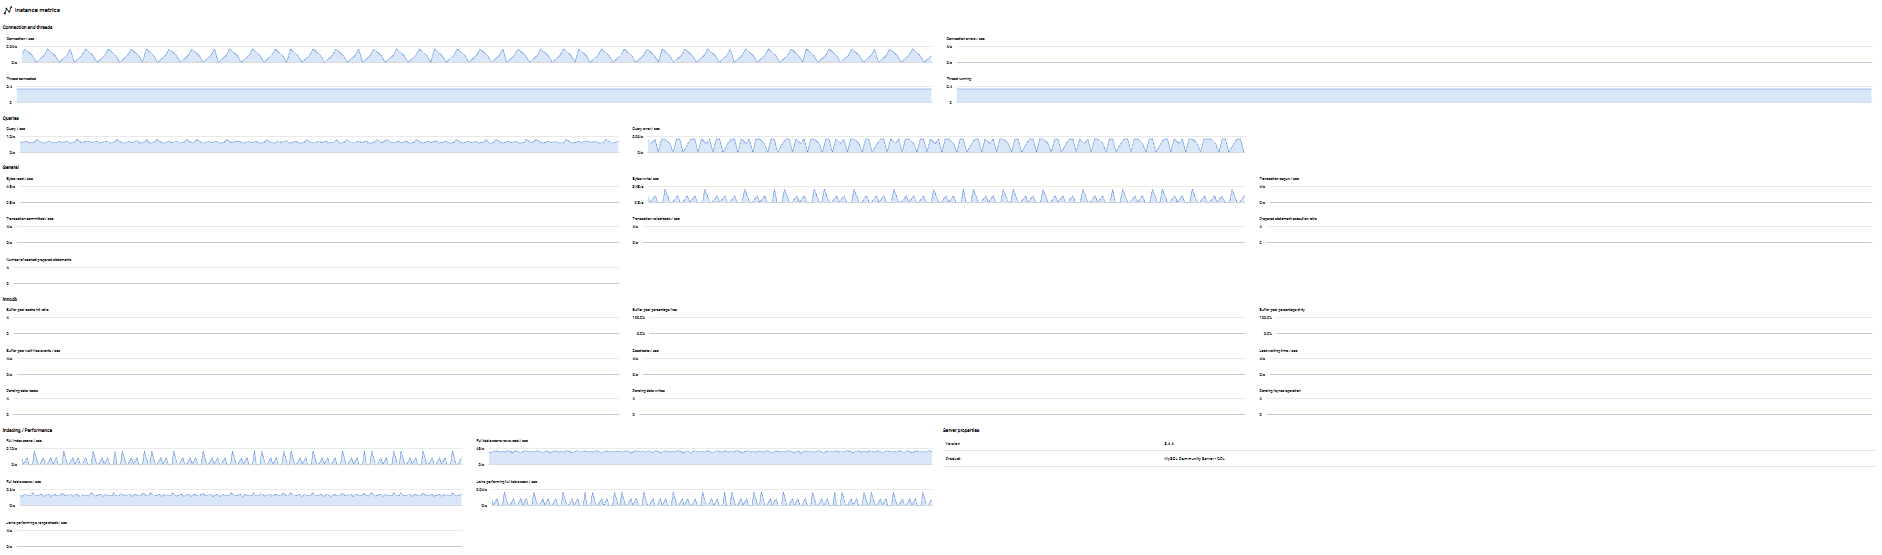
Instance Metrics
Provides detailed performance metrics specific to the MySQL instance, helping you monitor database activity, connection patterns, query efficiency, and InnoDB storage engine performance.
Connection and Threads
Tracks MySQL connection and thread activity:
- Connection per second: The rate of new client connections. Rapid fluctuations may indicate connection pooling issues or application restarts.
- Connection error per second: The rate of failed connection attempts. Spikes may indicate authentication failures, connection limit exhaustion, or network issues.
- Threads connected: The current number of open connections. Monitor against max_connections to ensure capacity.
- Threads running: The number of threads actively executing queries (not sleeping). High values may indicate slow queries or resource contention.
Queries
Monitors query execution patterns:
- Query per second: The overall rate of queries being executed. Use this to understand workload patterns and capacity requirements.
- Query error per second: The rate of failed queries. Sustained errors may indicate application bugs, permission issues, or SQL syntax problems.
General
Displays transaction and I/O activity:
- Bytes read per second: The rate of data being read from storage. High values combined with slow performance suggest disk bottlenecks.
- Bytes written per second: The rate of data being written to storage. Monitor for write-heavy workloads that may strain I/O capacity.
- Transaction begun per second: The rate at which new transactions start.
- Transaction committed per second: The rate of successfully completed transactions.
- Transaction rolled back per second: The rate of aborted transactions. High rollback rates may indicate application errors, deadlocks, or timeout issues.
- Prepared statement execution ratio: The percentage of queries using prepared statements versus text protocol. Higher ratios indicate better query plan caching and security.
- Cached prepared statements: The number of prepared statements currently cached, reducing parse overhead for repeated queries.
InnoDB
Monitors the InnoDB storage engine, which handles most MySQL workloads:
- Buffer pool cache hit ratio: The percentage of data pages found in memory rather than requiring disk reads. Values above 95-99% are ideal; lower values suggest the buffer pool is undersized.
- Buffer pool percentage free: The proportion of unused buffer pool pages available for new data. Low values may indicate the buffer pool is full and evicting frequently used data.
- Buffer pool percentage dirty: The percentage of modified pages waiting to be written to disk. Very high values may indicate checkpoint tuning is needed.
- Buffer pool wait free events per second: The rate at which queries wait for free buffer pool pages. Non-zero values indicate severe memory pressure.
- Deadlocks per second: The rate of transaction deadlocks detected. Occasional deadlocks are normal, but frequent occurrences suggest application logic issues or index design problems.
- Lock waiting time per second: The total time spent waiting for row locks. High values indicate contention that may require query optimization or schema changes.
- Pending data reads: The number of pending read operations. Sustained high values suggest I/O bottlenecks.
- Pending data writes: The number of pending write operations. High values may indicate slow disk writes or checkpoint delays.
- Pending data fsyncs: The number of pending fsync operations waiting to flush data to disk. Spikes often correlate with commits or checkpoints.
Indexing / Performance
Identifies query efficiency issues:
- Full index scans per second: The rate of queries scanning entire indexes. While better than table scans, frequent full index scans may indicate missing composite indexes or suboptimal query conditions.
- Full table scan rows read per second: The rate of rows read during full table scans. High values strongly suggest missing indexes.
- Full table scans per second: The rate of queries performing full table scans. Frequent table scans on large tables severely impact performance and should be addressed with appropriate indexes.
- Joins performing full table scan per second: The rate of JOIN operations requiring full table scans. These are particularly expensive and almost always indicate missing indexes on join columns.
- Joins performing range check per second: The rate of JOINs evaluating multiple range conditions per row. These can be expensive and may benefit from index optimization or query rewriting.
Monitor these metrics to identify queries that need indexing. Even small tables can benefit from indexes when frequently joined or filtered.
Server Properties
Displays MySQL instance configuration details:
- Version: The MySQL server version number (e.g., 8.0.35, 5.7.42), important for tracking features, security updates, and compatibility.
- Product: The MySQL edition or distribution (e.g., MySQL Community, MySQL Enterprise, MariaDB, Percona Server), which determines available features and support options.
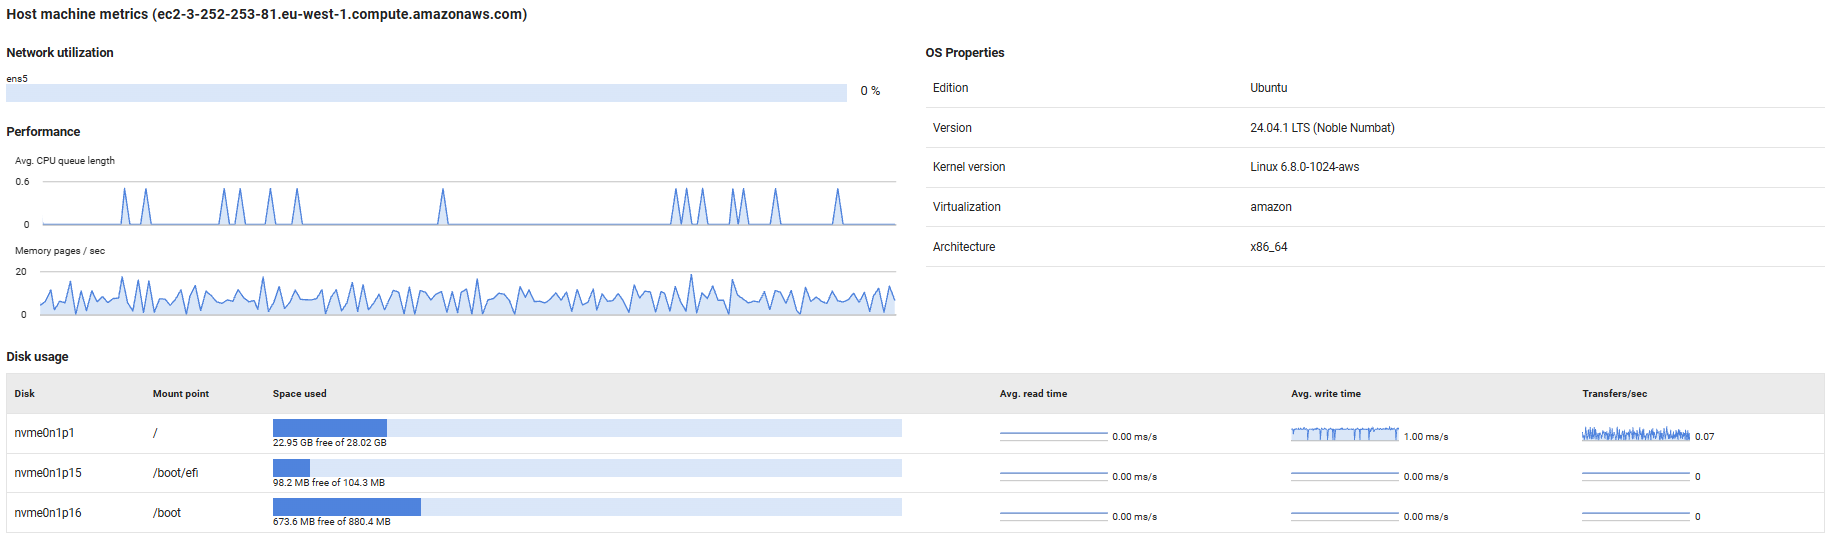
Host Machine Metrics
Provides visibility into the physical or virtual host server's resource utilization and configuration, helping you monitor the infrastructure layer supporting your MySQL instance.
Network Utilization
Displays the current network bandwidth usage as a percentage for each network interface on the host machine. High utilization rates (typically above 80%) may indicate network saturation, which can lead to slow query response times, replication delays, or connectivity issues for database clients.
Performance
Tracks key host-level performance indicators:
- Avg. CPU queue length: Shows the average number of threads waiting for CPU time. Values consistently above 2-4 (depending on CPU core count) indicate the host is CPU-bound, which can slow down database operations.
- Memory pages/sec: Measures the rate at which the operating system is reading from or writing to the page file (virtual memory on disk). High values indicate memory pressure, forcing the OS to swap memory contents to disk, which severely degrades database performance. This should remain close to zero for optimal performance.
OS Properties
Displays operating system configuration details:
- For Linux hosts: Shows the distribution edition (e.g., Ubuntu, Red Hat Enterprise Linux), OS version, kernel version, virtualization technology (if applicable, such as KVM or VMware), and architecture (e.g., x86_64, ARM64).
- For Windows hosts: Shows the Windows edition, version number, and build number.
This information is useful for compatibility verification, patch management, and troubleshooting OS-specific issues.
Disk Usage
Provides detailed disk performance and capacity metrics:
- Space used: Visual bar chart showing used versus free disk space. Monitor this to prevent running out of space, which can cause MySQL to stop accepting writes or crash.
- Avg. read/write time: Sparkline graphs displaying average disk read and write latency over time. Increasing latency values indicate disk performance degradation, which directly impacts query performance and transaction commits.
- Transfers/sec: Shows the rate of disk I/O operations. High transfer rates combined with high latency suggest the disk subsystem is overloaded and may benefit from faster storage (e.g., SSDs) or distributing data across multiple volumes.
Note: Throughput metrics are not available for mapped network drives.
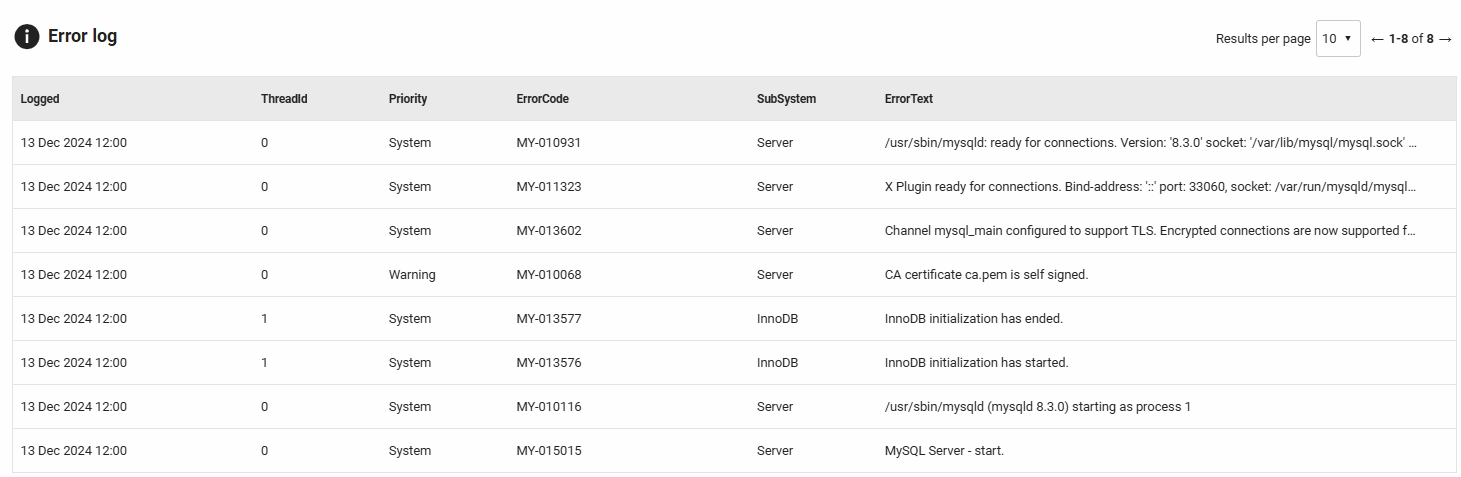
Error Log
Displays recent errors and warnings from the MySQL error log (performance_schema.error_log), excluding informational notes to focus on actionable issues during the selected time period. This section helps you quickly identify and diagnose database problems.
Columns displayed:
- Logged: The timestamp when the error was recorded.
- Thread ID: The MySQL thread identifier that encountered the error, useful for correlating with connection or process lists.
- Priority: The severity level (System, Error, or Warning).
- Error code: The MySQL error number (e.g., MY-010914, MY-013172) for quick reference in MySQL documentation.
- SubSystem: The MySQL component or subsystem that generated the message (e.g., InnoDB, Replication, Server, Plugin).
- Error text: The complete error message with context and details.
Common issues to monitor:
- Replication errors: Messages from the Replication subsystem about slave lag, connection issues, or data inconsistencies.
- InnoDB errors: Storage engine messages about corruption, tablespace issues, or buffer pool problems.
- Connection issues: Errors about max connections reached, authentication failures, or SSL/TLS problems.
- Plugin failures: Problems loading or running MySQL plugins that may affect functionality.
- Deadlocks and lock timeouts: Transaction conflicts that may indicate application design issues.
- Configuration warnings: Messages about deprecated settings or suboptimal configuration values.
Use this section to proactively address issues before they escalate. Regular review of error patterns helps identify recurring problems that may require application changes, schema modifications, or server configuration adjustments.
Current activity
Redgate Monitor shows you which queries are running on your MySQL instance in the current activity tab.
This allows you to inspect your server activity in real time, giving you the ability to identify a problem query while it's still running or simply be able to react even before the query finishes.
If you have Query analysis enabled, click on a query and use the purple Analyze Query button in the query details pane to generate AI-powered insights.
Refreshing the data
By default, the data on the current activity tab does not refresh. If you wish to refresh the data, use the Refresh button for a one-off refresh, or enable Auto-refresh. You can configure the Auto-refresh interval using the dropdown.
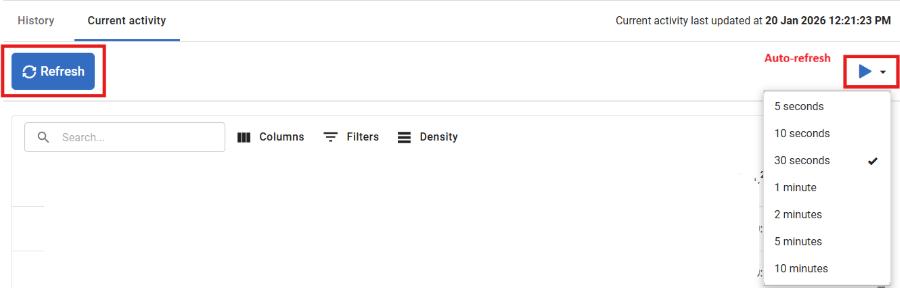
Unlike other views in Redgate Monitor, the data shown on the current activity tab is displayed without being saved to Redgate Monitor Repository, this means once the page is refreshed you will lose the data shown on the page.
Query text truncation
MySQL truncates query text by default. See Configuring query text length.
This documentation contains proprietary information and is protected by copyright law.
Copyright © 2026 Red Gate Software Limited. All rights reserved


