Oracle Instance Overview
Published 19 January 2026
The Oracle server overview provides comprehensive visibility into:
- Infrastructure health through CPU, memory, and disk metrics
- Database performance via wait events, query metrics, and I/O patterns
- Resource utilization through instance metrics and buffer cache efficiency
- Multitenant architecture status via container monitoring
- System stability through error logs and session monitoring
Regular monitoring of these metrics helps maintain optimal Oracle database performance, prevent resource exhaustion, identify slow queries and missing indexes, and quickly diagnose issues before they impact applications or users. Pay special attention to wait events, buffer cache hit ratios, and temp I/O waits as key indicators of database health.
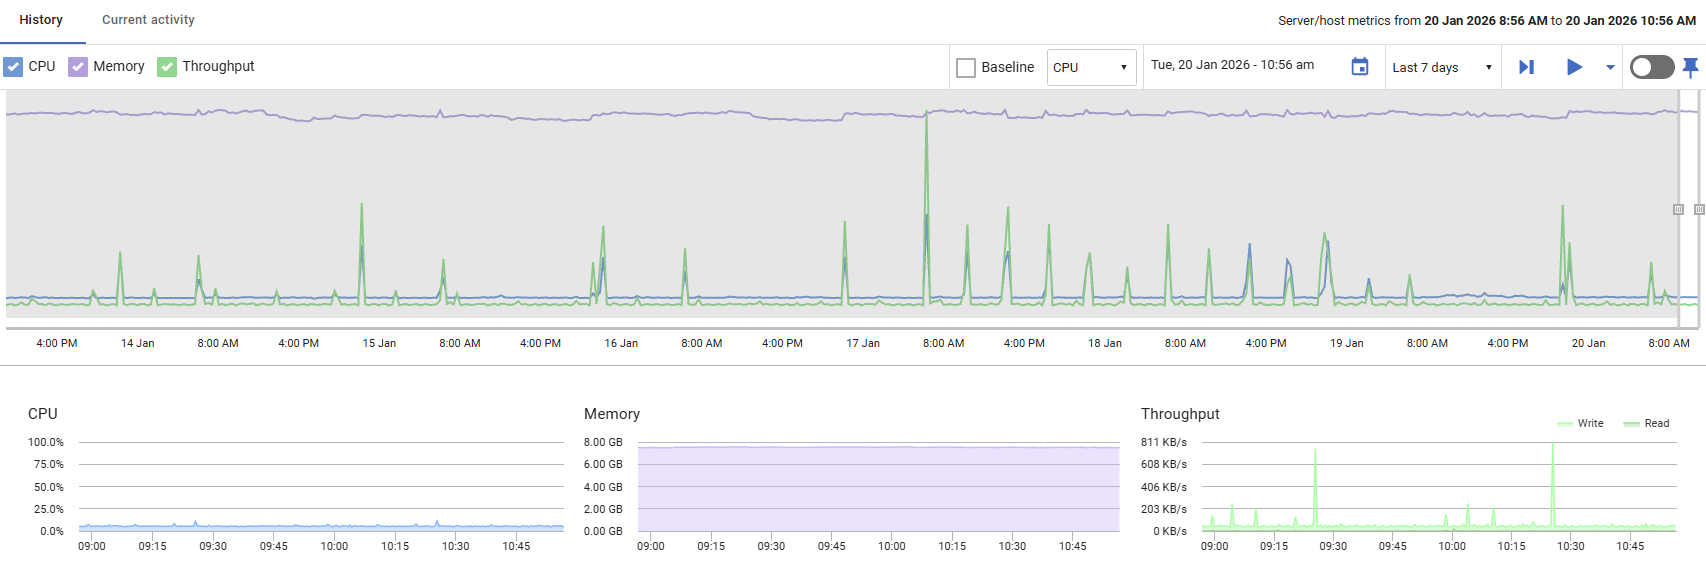
Server/Host metrics
CPU
Displays the percentage of processor time being used by the host machine. Values range from 0% to 100%, with higher values indicating increased processor workload.
Memory
Shows the amount of memory currently in use by the host machine, displayed relative to total available capacity. This helps you monitor memory consumption and identify potential resource constraints.
Throughput
Displays disk I/O activity, showing read and write operations in bytes per second. This metric helps you track the volume of data being transferred to and from disk storage
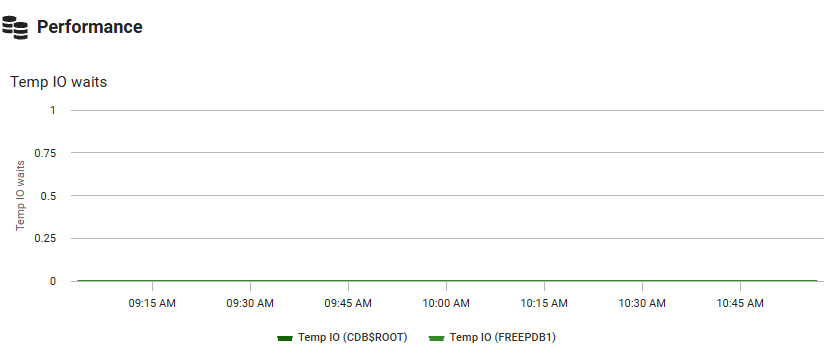
Performance
Temp I/O Waits
Shows wait events for temporary tablespace operations, such as sorting and hash joins that require disk-based temporary storage. Spikes indicate queries are performing memory-intensive operations that exceed available memory. In multi-tenant environments, the graph breaks down waits by container to identify which pluggable databases are affected.
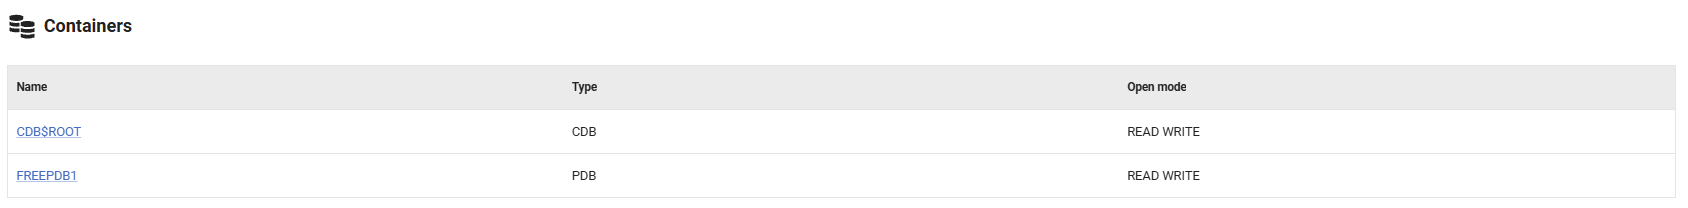
Containers
Lists all containers in Oracle multitenant database architectures, showing the Container Database (CDB) and its Pluggable Databases (PDBs). Each entry displays the container name, type, and open mode (such as READ WRITE, READ ONLY, or MOUNTED), providing visibility into the status and accessibility of each database within your multitenant environment.
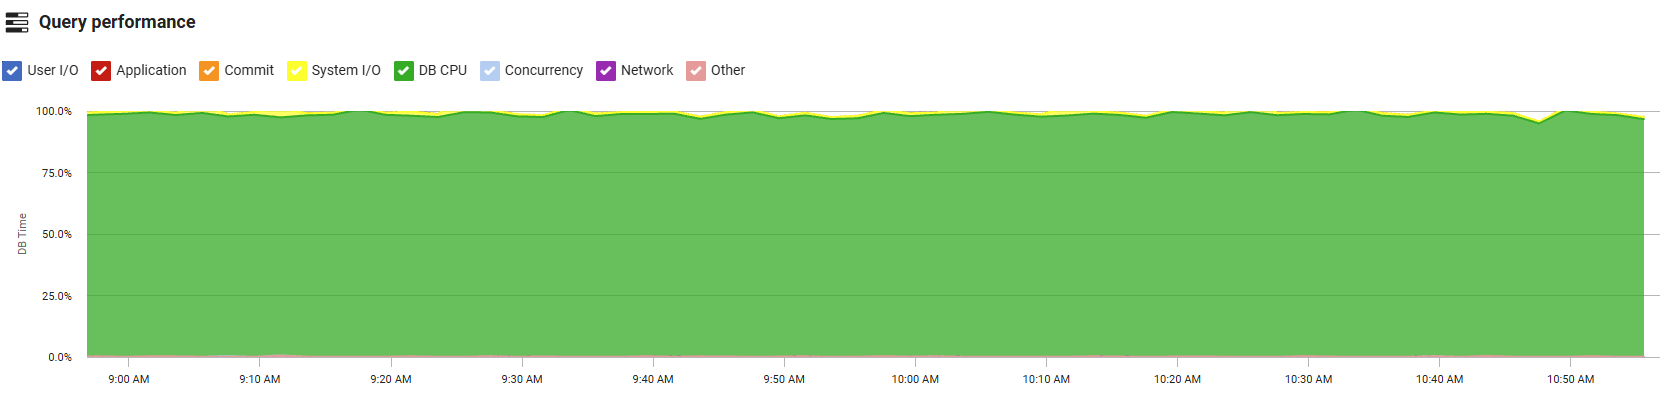
Query Performance
Provides comprehensive insights into Oracle database performance by tracking wait events and query execution metrics. The interactive graph displays wait classes over time, allowing you to filter specific wait classes using the checkboxes to focus on areas of interest. Wait classes categorize Oracle wait events into groups such as User I/O, System I/O, Concurrency, Application, and Network, helping you identify where the database is spending time waiting for resources.
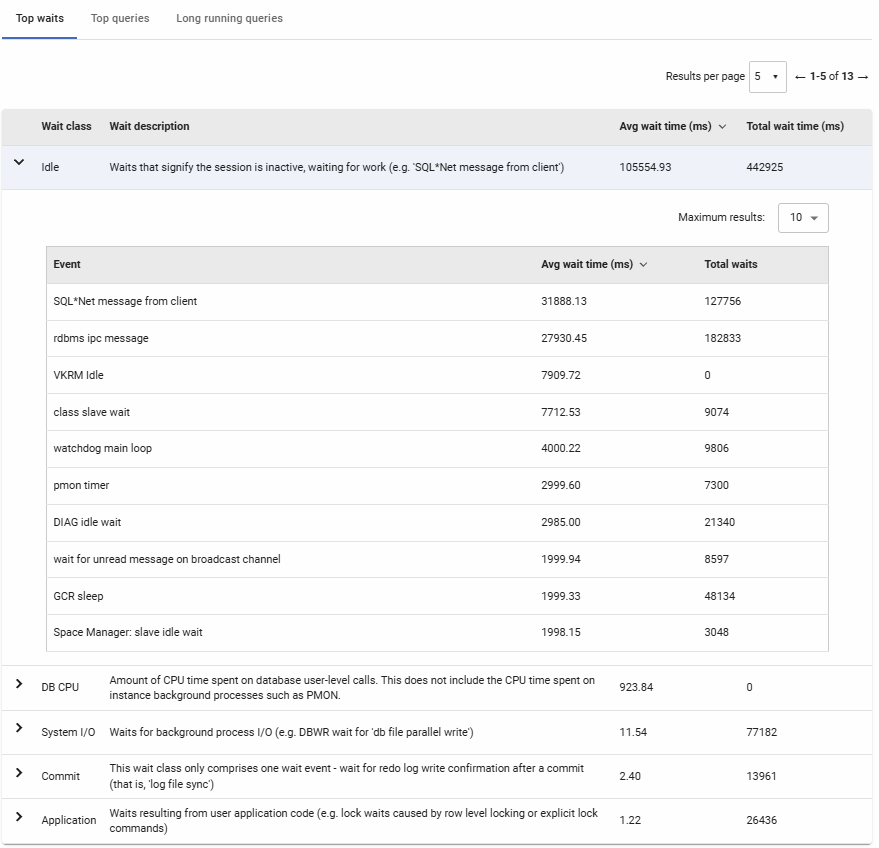
Top Waits
Displays the most significant wait events grouped by wait class during the selected time period. Each wait class can be expanded to reveal the individual wait events contributing to that class, along with their average and total wait times in milliseconds. This breakdown helps identify specific bottlenecks—for example, high User I/O waits may indicate disk performance issues, while Concurrency waits often point to contention for locks or latches. Use this data to prioritize performance tuning efforts based on where the database is spending the most time waiting.
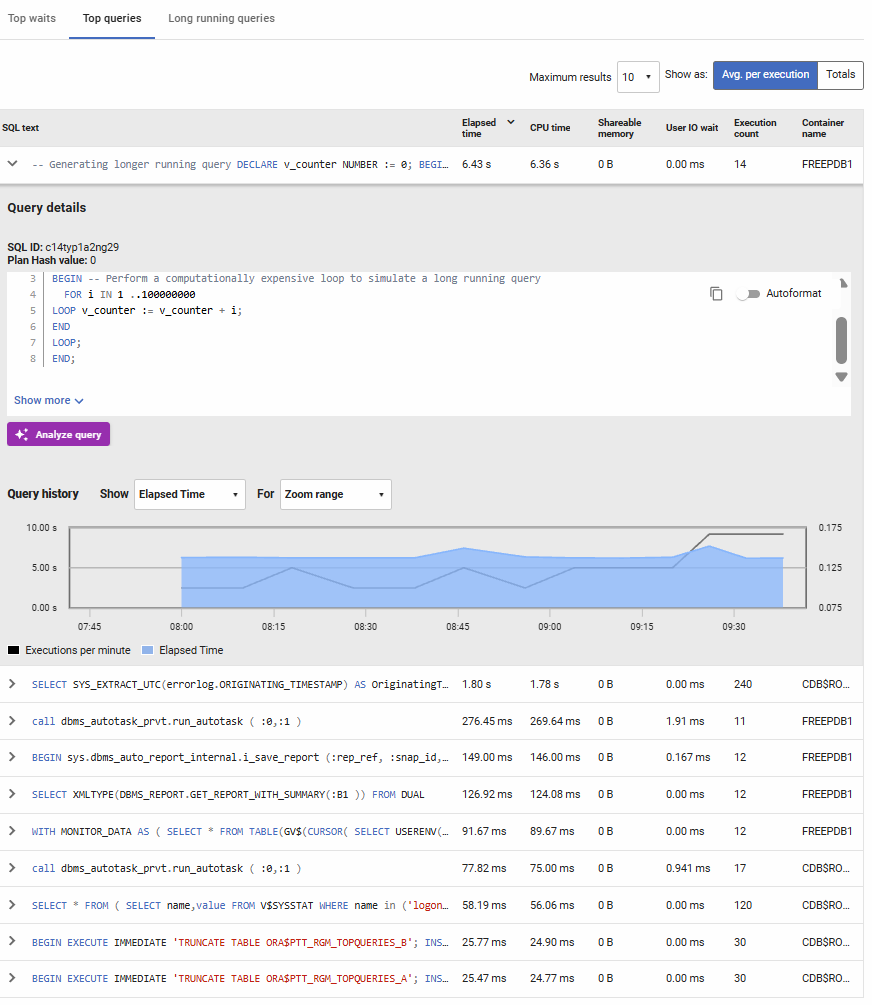
Top Queries
Lists the most resource-intensive queries based on metrics such as elapsed time, CPU time, user I/O wait, shareable memory, and execution count. You can toggle between viewing total values or averages per execution, and sort by any column to identify problematic queries. Expanding a query reveals its full SQL text, execution history over time, and additional performance details. In multitenant environments, the container name shows which pluggable database each query belongs to. Use this information to identify queries that need optimization through indexing, query rewriting, or execution plan analysis. The Analyze query button provides an AI assistant to review the query and suggest improvements, click here to view the documentation
Long Running Queries
Shows the top 10 longest-running queries currently executing or recently completed during the selected time range. Each entry displays session information including the username, host machine, program, login time, and SQL execution start time, along with the total duration. This helps you quickly identify queries that may be stuck, running longer than expected, or consuming excessive resources. Expanding a row reveals the full SQL command text for detailed analysis.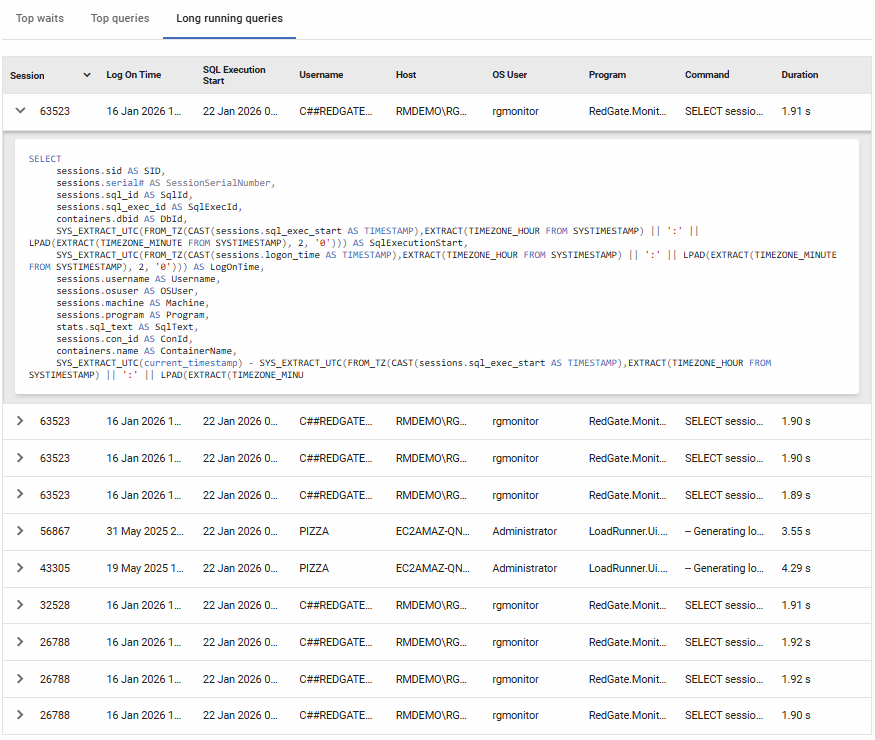
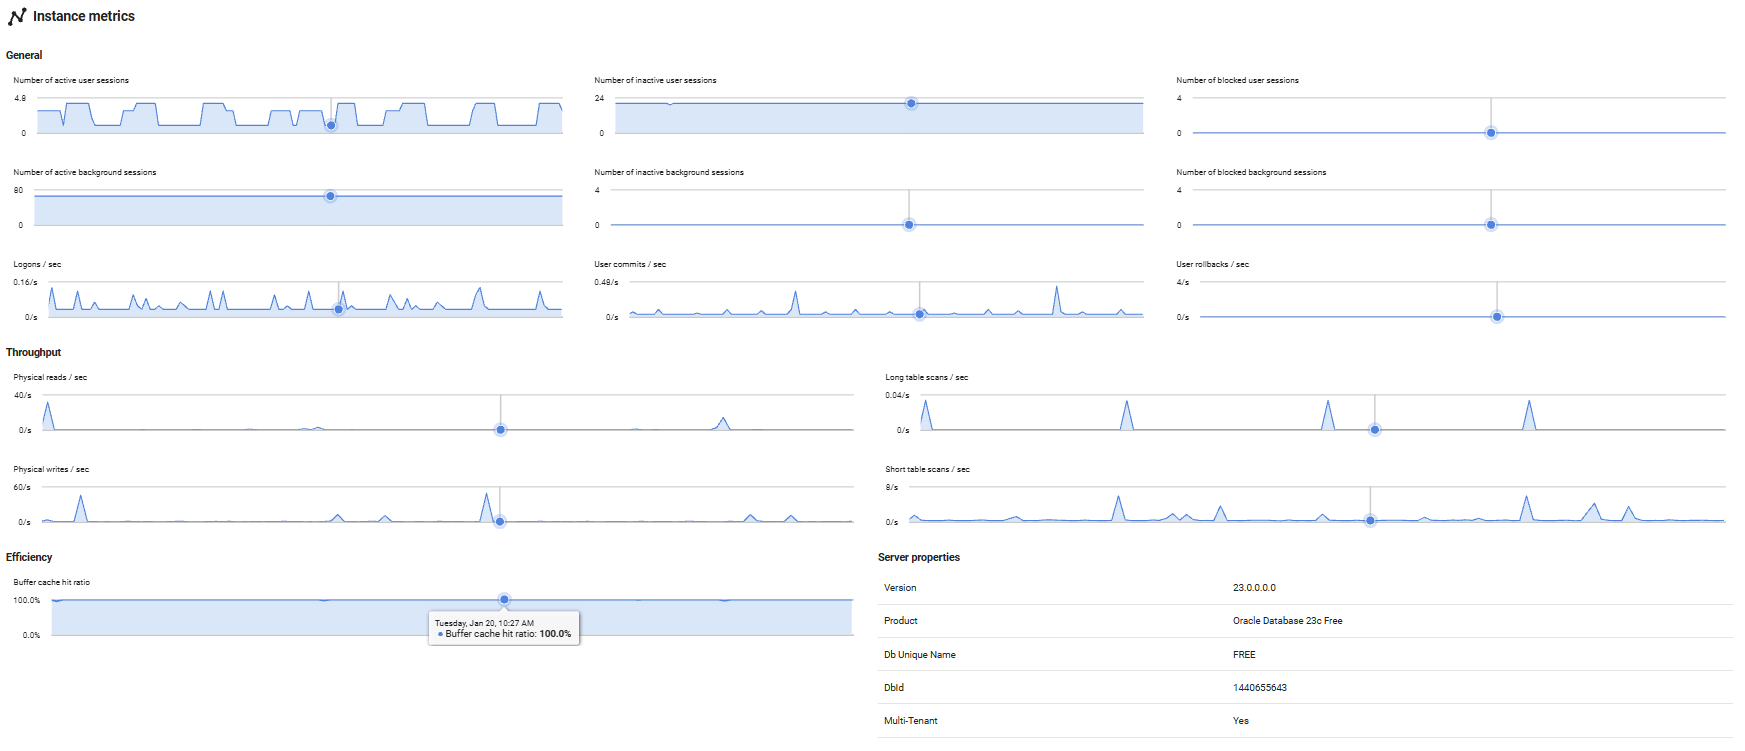
Instance metrics
Provides detailed performance metrics specific to the Oracle database instance, helping you monitor database activity, I/O patterns, and memory efficiency. These metrics are essential for understanding database workload and identifying optimization opportunities.
General
Displays session and transaction activity metrics that indicate database workload and user activity levels:
Session counts: Shows the number of active, inactive, and blocked sessions for both user connections and Oracle background processes. High numbers of blocked sessions may indicate locking or contention issues that need investigation.
Logons per second: Tracks the rate of new database connections, helping identify connection patterns and potential connection pooling issues.
User commits/rollbacks per second: Monitors transaction completion rates. A high rollback rate compared to commits may indicate application errors or transaction conflicts that require attention.
Throughput
Tracks database I/O activity to help identify disk performance patterns and query efficiency:
Physical reads/writes per second: Measures actual disk I/O operations. High physical read rates may indicate insufficient memory allocation forcing Oracle to read from disk more frequently than optimal.
Long table scans per second: Counts full table scans on large tables. Frequent long table scans often suggest missing indexes or inefficient queries that could benefit from optimization.
Short table scans per second: Tracks full scans on small tables, which is often acceptable and can be more efficient than index access for small datasets.
Efficiency
Evaluates how effectively Oracle is using memory resources:
Buffer cache ratio: Shows the percentage of data blocks found in memory rather than requiring disk reads. Higher values (typically above 90%) indicate good memory utilization, while lower values suggest the buffer cache may be undersized or queries are inefficiently accessing data.
Server Properties
Displays key configuration and identification information about the Oracle database instance:
Version: The Oracle Database version number (e.g., 19c, 21c), helping you track which release is running and ensure compatibility with applications and features.
Product: The Oracle Database edition (such as Enterprise Edition, Standard Edition, or Express Edition), which determines available features and licensing.
Db Unique Name: The unique identifier for the database within the Oracle environment, particularly important in Data Guard configurations where multiple databases may share the same database name but have different unique names.
DbId: The internal database identifier assigned by Oracle when the database was created. This remains constant throughout the database's lifetime and is used for recovery and replication operations.
Multi-Tenant: Indicates whether the database is configured as a multitenant container database (CDB) that can host pluggable databases (PDBs). A "Yes" value means the instance supports Oracle's multitenant architecture.
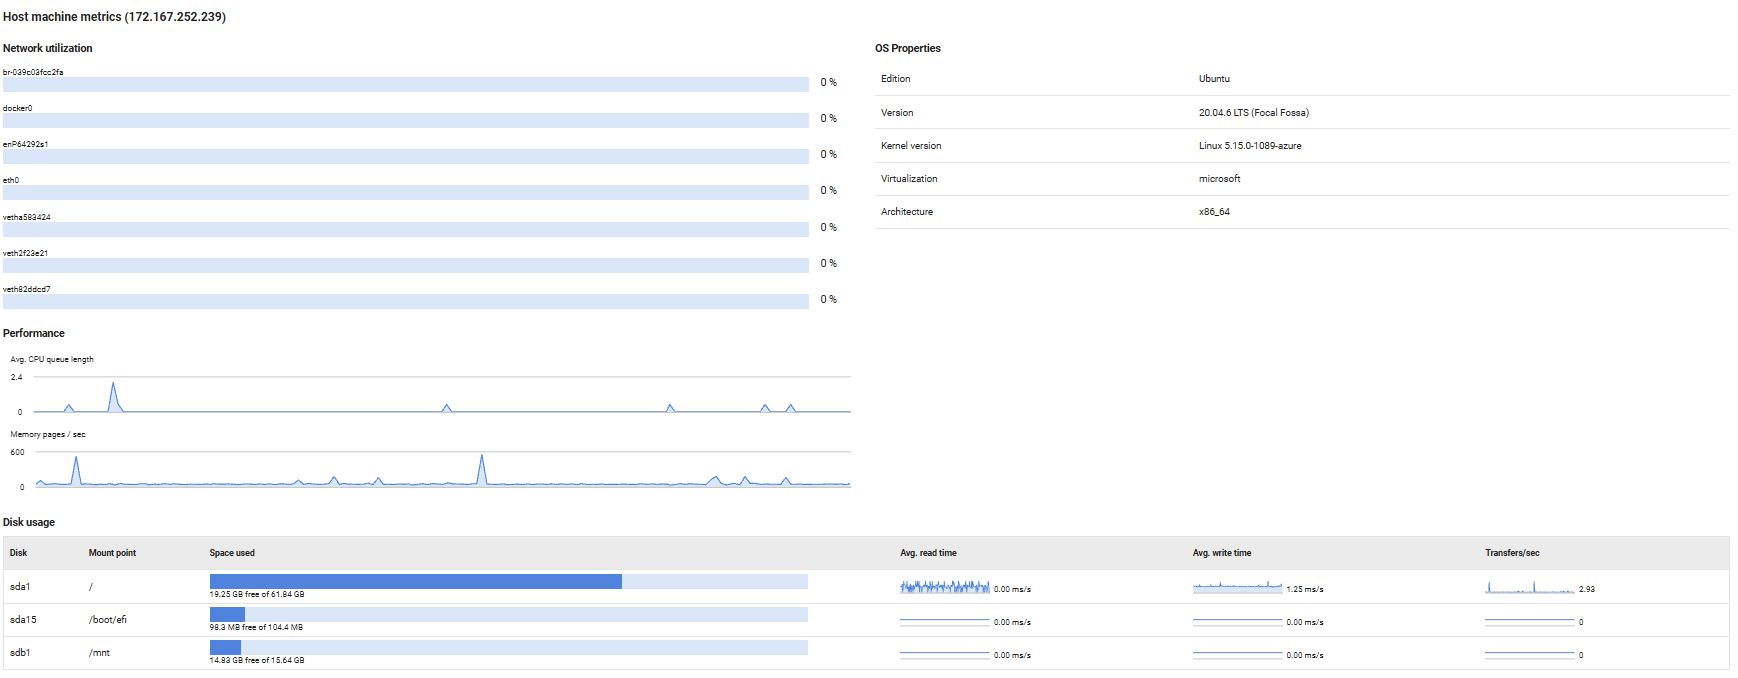
Host Machine Metrics
Provides visibility into the physical or virtual host server's resource utilization and configuration, helping you monitor the infrastructure layer supporting your database instances. These metrics are essential for identifying hardware-level bottlenecks that may impact database performance.
Network Utilization
Displays the current network bandwidth usage as a percentage for each network interface on the host machine. High utilization rates (typically above 80%) may indicate network saturation, which can lead to slow query response times, replication delays, or connectivity issues for database clients.
Performance
Tracks key host-level performance indicators that affect database responsiveness:
Avg. CPU queue length: Shows the average number of threads waiting for CPU time. Values consistently above 2-4 (depending on CPU core count) indicate the host is CPU-bound, which can slow down database query processing and transaction throughput.
Memory pages/sec: Measures the rate at which the operating system is reading from or writing to the page file (virtual memory on disk). High values indicate memory pressure, forcing the OS to swap memory contents to disk, which severely degrades database performance. Ideally, this should remain close to zero for optimal performance.
OS Properties
Displays operating system configuration details:
For Linux hosts: Shows the distribution edition (e.g., Ubuntu, Red Hat Enterprise Linux), OS version, kernel version, virtualization technology (if applicable, such as KVM or VMware), and architecture (e.g., x86_64, ARM64).
For Windows hosts: Shows the Windows edition (e.g., Windows Server 2019, 2022), version number, and build number.
This information is useful for compatibility verification, patch management, and troubleshooting OS-specific issues.
Disk Usage
Provides detailed disk performance and capacity metrics for each disk or mount point:
Space used: Visual bar chart showing used versus free disk space. Monitor this to prevent running out of space, which can cause database crashes or transaction log failures.
Avg. read/write time: Sparkline graphs displaying average disk read and write latency over time. Increasing latency values indicate disk performance degradation, which directly impacts query performance, especially for I/O-intensive operations.
Transfers/sec: Shows the rate of disk I/O operations. High transfer rates combined with high latency suggest the disk subsystem is overloaded and may benefit from faster storage or load balancing across multiple disks.
Note: Throughput metrics are not available for mapped network drives.
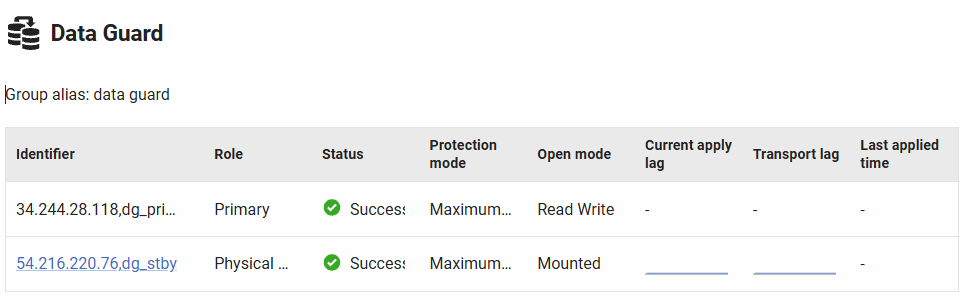
Data Guard
Displays monitoring information for Oracle Data Guard configurations, showing the status and replication health of all databases within a Data Guard group. Oracle Data Guard provides high availability, disaster recovery, and data protection through physical or logical standby databases. This section appears only when the Oracle instance is part of a Data Guard configuration.
Data Guard configurations consist of a primary database and one or more standby databases. The primary database handles all production transactions, while standby databases receive and apply redo data to maintain synchronized copies. This section shows all members of the Data Guard group, their current roles, and replication lag metrics.
Table Columns
Identifier: The database name within the Data Guard configuration. Click to navigate to that database's server overview page (for monitored instances). The current database is shown as plain text.
Role: The current database role in the Data Guard configuration:
- Primary: The production database accepting read-write transactions
- Physical standby: A block-for-block identical copy of the primary, maintained through redo apply
- Logical standby: Maintains data using SQL statements from redo, allowing read-write access on some tables
- Snapshot standby: A fully updatable snapshot for testing, can be converted back to physical standby
Status: Health indicator for the Data Guard replica:
- Success (green checkmark): Operating normally, status code 0
- Warning (orange warning): Minor issues detected, status code < 100
- Error (red X): Significant problems, displays ORA-error code
Hover over the icon to see the specific status code or ORA-error number.
Protection mode: The Data Guard protection level configured:
- Maximum Protection: Zero data loss guarantee, transactions commit only after redo is written to standby
- Maximum Availability: Zero data loss under normal conditions, degrades to maximum performance if standby unavailable
- Maximum Performance: Minimal impact to primary performance, allows some data loss if primary fails
Open mode: Current accessibility state of the database:
- READ WRITE: Primary database, accepting all transactions
- READ ONLY: Standby database open for read-only queries (Active Data Guard)
- READ ONLY WITH APPLY: Active Data Guard with real-time query capability while applying redo
- MOUNTED: Standby database mounted but not open, applying redo in the background
Current apply lag: Sparkline graph showing the time difference between when redo was generated on the primary and when it was applied on the standby. The graph displays historical lag values over the selected time period, helping identify trends and spikes. Low, consistent values indicate healthy replication; increasing lag suggests the standby is falling behind.
Transport lag: Sparkline graph showing the delay between when redo was generated on the primary and when it arrived at the standby. This measures network and transport performance. High transport lag may indicate network issues, insufficient bandwidth, or LGWR (log writer) contention on the primary.
Last applied time: Timestamp of the most recent redo application on the standby database. Compare this to the current time to quickly assess if the standby is up-to-date or has stopped applying redo.
Group Information
At the top of the section, the Group alias displays the Data Guard broker configuration name. This helps identify which logical Data Guard group you're viewing when managing multiple Data Guard configurations.
Understanding Lag Metrics
Transport lag and Apply lag work together to show the complete replication picture:
Transport lag: Time from redo generation on primary until arrival at standby
- Low values (< 1 second): Good network and log shipping performance
- High values: May indicate network problems, ASYNC transport mode, or primary under heavy load
Apply lag: Time from redo arrival at standby until it's applied to the standby database
- Low values (< 1 second): Standby keeping pace with primary changes
- High values: May indicate insufficient standby resources, checkpoint delays, or complex redo operations
Total lag = Transport lag + Apply lag
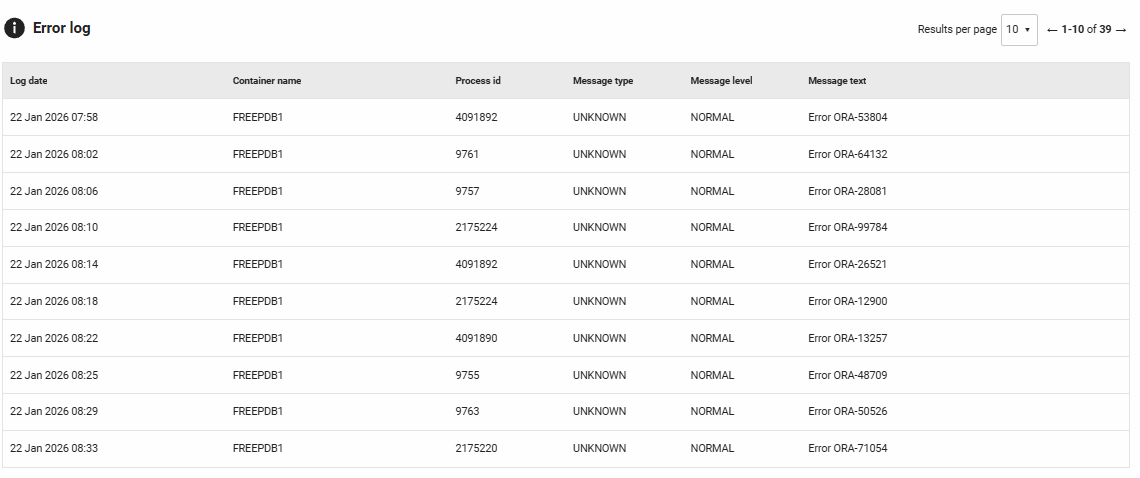
Error Log
Shows entries from Oracle's diagnostic alert log (V$DIAG_ALERT_EXT) filtered to display errors and ORA- messages during the selected time period. This section helps you monitor database health and quickly identify issues.
Columns displayed:
- Log date: When the error was recorded
- Container name: The pluggable database (PDB) or container database (CDB) where the error occurred, helpful for troubleshooting in multitenant environments
- Process id: The Oracle process that generated the message
- Message type: The category of the diagnostic message
- Message level: The severity or importance level of the message
- Message text: The full error description, including ORA- error codes and details
Current activity
Redgate Monitor shows you which queries are running on your Oracle instance or container in the current activity tab.
If viewing the current activity tab for a specific CBD or PDB, the data displayed will relate to that container only. To view data for the whole instance, first visit the instance overview and click on the current activity tab from there.
This allows you to inspect activity on your containers or instance in real time, giving you the ability to identify a problem query while it's still running or simply be able to react even before the query finishes.
If you have Query analysis enabled, click on a query and use the purple Analyze Query button in the query details pane to generate AI-powered insights.
Refreshing the data
By default, the data on the current activity tab does not refresh. If you wish to refresh the data, use the Refresh button for a one-off refresh, or enable Auto-refresh. You can configure the Auto-refresh interval using the dropdown.
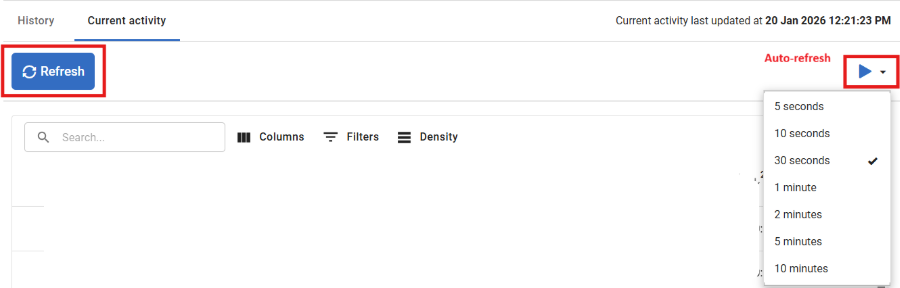
Unlike other views in Redgate Monitor, the data shown on the current activity tab is displayed without being saved to Redgate Monitor Repository, this means once the page is refreshed you will lose the data shown on the page.
This documentation contains proprietary information and is protected by copyright law.
Copyright © 2026 Red Gate Software Limited. All rights reserved


