Query executions
Published 17 December 2024
Supported environments
Redgate Monitor supports query execution monitoring for SQL Server on Windows, Linux, Azure, Google Cloud SQL and Amazon RDS environments running SQL Server 2017 or later.
We do not support query execution monitoring on the Web or Express editions of Amazon RDS SQL Server, SQL Server 2012 and SQL Server 2008 R2.
Redgate Monitor can collect data on individual executions of long running queries. This information can be found on the server overview's query executions tab. The threshold for a query to be monitored can be configured from 1-5 seconds. Any query with a run time above the given threshold will be monitored.
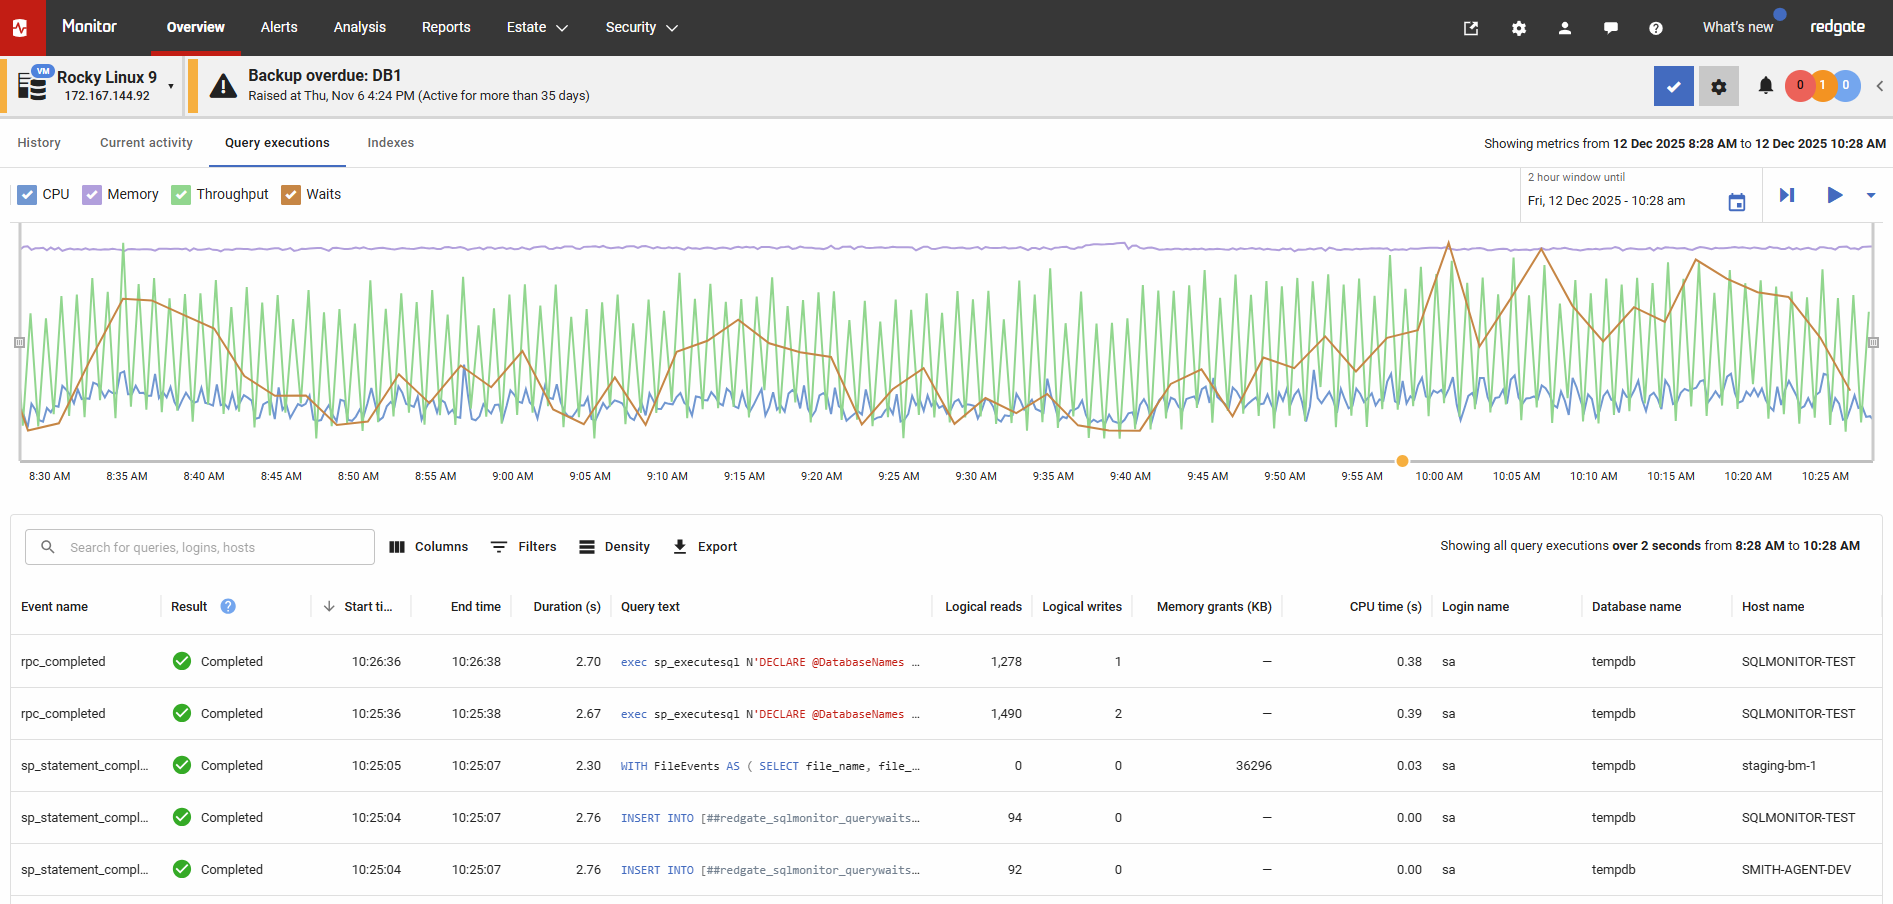
The tab contains a copy of the history tab's activity graph allowing you to compare spikes in CPU, memory usage, throughput and waits with the long running queries that were executing at that time.
Configuring query execution monitoring
Query execution monitoring is disabled by default on all monitored instances; it can be enabled for specific instances using the Additional monitoring settings page located in Configuration > Advanced.
For each instance, enabling query execution monitoring requires permission to create an Extended Events session, and will require up to 40MB of disk space for the session log files.
For Azure platforms, the Extended Events session will write session log files to an Azure Blob Storage container that you provision. See Azure prerequisites.

Impact of enabling query execution monitoring
While extended events are designed to be lightweight, there is both a performance and storage impact of enabling query execution monitoring. This varies based on the time threshold selected and the activity of the underlying estate. Setting a low time threshold value of 1 second for a large number of servers over a long period of time may significantly increase the size of a Base Monitor's data repository, depending on the frequency and size of the queries. For this reason, it's recommended that query execution monitoring is enabled permanently only for key instances, and used temporarily when trying to diagnose specific issues on other instances.
Azure prerequisites
For Azure Managed Instances and Azure SQL databases, Redgate Monitor requires a blob store URL with correct permissions configured. This allows Redgate Monitor to create the extended event sessions underpinning the query executions feature.
Please note that query execution monitoring cannot be enabled on a secondary Azure SQL Hyperscale replica. Only primary replicas are supported.
Before enabling query execution monitoring on an Azure SQL Database, you need to:
- Provision a Azure Storage account and blob container in the same Azure region as your database. It should be a standard tier blob store.
- Generate a SAS (Shared Access Signature) token for the container with at minimum Read, Write, Delete, and List permissions.
- Create the required credential on the database (see below).
- Provide the blob container URL to Redgate Monitor via Configuration > Advanced > Additional monitoring settings.
For Azure SQL Database, Azure will handle removing stale .xel blobs via the MAX_ROLLOVER_FILES parameter.
Before enabling query execution monitoring on an Azure Managed Instance, you need to:
- Provision a Azure Storage account and blob container in the same Azure region as your managed instance. It should be a standard tier blob store.
- Generate a SAS (Shared Access Signature) token for the container with at minimum Read, Write, Delete, and List permissions.
- Create the required credential on the instance (see below).
- Provide the blob container URL to Redgate Monitor via Configuration > Advanced > Additional monitoring settings.
- Provide the SAS token to Redgate Monitor in the same Additional monitoring settings screen. Redgate Monitor stores this token encrypted and uses it to periodically remove stale .xel blobs from your container.
For Azure Managed Instances, Redgate Monitor automatically sweeps stale .xel blobs from your container on a schedule using the stored SAS token.
Please be aware that there are costs incurred writing files to Azure storage accounts. According to Microsoft's documentation, the cost per GB for a page blob is $0.045 per GB with LRS (locally-redundant storage), $0.06 per GB with GRS (geo-redundant storage) and $0.075 with RA-GRS (read-access geo-redundant storage). The automated blob cleanup functionality in Redgate Monitor should mean there is rarely ever more than 40mb's worth of extended event logs in storage per Azure SQL Database and Azure Managed Instance.
Creating the required credentials - Azure Managed Instance
Run the following T-SQL in the master database (or any database connected with a login that has server-level permissions). Replace placeholder values with your storage account details and SAS token.
Creating server-scoped credentials
-- Create a server-scoped credential whose name matches the base blob container URL.
-- The IDENTITY must be 'SHARED ACCESS SIGNATURE' (literal string).
-- The SECRET is the SAS token value, without the leading '?'.
CREATE CREDENTIAL [https://<storage_account>.blob.core.windows.net/<container>]
WITH IDENTITY = 'SHARED ACCESS SIGNATURE',
SECRET = '<your_sas_token_without_leading_?>';
Creating the required credentials - Azure SQL Database
Run the following T-SQL in the context of each database. Replace the placeholder values with your storage account name, container name, and SAS token.
Creating a database-scoped credentials
-- 1. Create a Database Master Key (required to protect the credential secret).
-- Skip this step if a master key already exists on this database.
CREATE MASTER KEY ENCRYPTION BY PASSWORD = '<choose a strong password>';

-- 2. Create a database-scoped credential whose name matches the base blob container URL
-- (without the SAS query string).
-- The IDENTITY must be 'SHARED ACCESS SIGNATURE' (literal string).
-- The SECRET is the SAS token value, without the leading '?'.
CREATE DATABASE SCOPED CREDENTIAL [https://<storage_account>.blob.core.windows.net/<container>]
WITH IDENTITY = 'SHARED ACCESS SIGNATURE',
SECRET = '<your_sas_token_without_leading_?>';
Query executions content
By default, the Query Executions table displays all queries with a duration over the selected time threshold that occurred within the last two hours. Each row includes the following details:
Captured Event Name
The name of the Extended Event that captured the query execution.Event Result
Indicates the outcome of the query execution, such ascompleted,error, oraborted.Duration Information
Includes the start and end timestamps of the query, as well as the total duration in seconds.Execution Details
Shows the full query text, the user who executed the query, and the database context in which it ran.Logical Reads and Writes
The number of logical page reads and writes the query performed.CPU Time (seconds)
The total CPU time consumed by the query, measured in seconds (converted from microseconds).- Memory Grants (Kb)
The total memory granted to a given query execution. This is an optional field that can be enabled or disabled, See Memory Grants below.
The data can be filtered on any of these properties, and individual columns can be hidden when not needed.
The raw parameter information captured in the query text column may include sensitive information or personal data. It's possible to redact query plan parameters for all users (incl. administrators), by setting the SQLMONITOR_AlwaysRedactQueryPlanParameters environment variable on the Website to true.
Memory Grants
Query executions can also capture memory grant usage.
SQL Server captures memory grants associated with extended events. By default, only grants larger than 5 MB are recorded.
You can adjust this threshold using the configuration key-value pair QueryInstance-MinimumMemoryGrantKb.
Lowering this value will capture smaller memory grants, providing more detailed insights but potentially increasing performance overhead. Raising the value will limit capture to larger grants, allowing you to focus only on those considered more significant.
Activity graph and time controls
The activity graph shows CPU and memory usage, as well as throughput and the amount of time spent on waits. Like on the history tab, the graph contains controls for changing the time-window the page represents.

This time-window is bounded to be between fifteen minutes and two hours and by default will end at the current time. The end time can be altered using the date picker. The time window can be narrowed by manually shrinking or growing the selector, which allows you to focus on specific times.

Altering the window or end time using these controls automatically alters the content of the query executions table.
Sidebar
Clicking on any of the table rows will open a sidebar. This sidebar contains the same content as the table row in a more readable format. This includes a window showing the full query text, which is often not fully visible in the table itself.

Query execution monitoring and extended events
Enabling query execution monitoring will result in an extended event session being created on the target server. On deleting or suspension of query execution monitoring, Redgate Monitor will automatically delete these extended event sessions.
SQL Server creates log files associated with this session, which are managed during monitoring, but SQL Server does not delete them if the session is deleted. They can be safely deleted manually to free up space if required. Their names start with redgatemonitor_queryinstances_.
This documentation contains proprietary information and is protected by copyright law.
Copyright © 2026 Red Gate Software Limited. All rights reserved


