Virtual Machines
Published 30 October 2025
The Virtual Machines page provides an overview of all virtual machines hosting SQL Server instances within your monitored estate, along with key usage metrics such as CPU, memory, and storage utilization.
- Available from version 14.3.0.2906, with some features appearing in subsequent releases. See the Release Notes for full information.
- Enhanced data can be shown for VMs hosted in the cloud. See Managing cloud services for information on how to add credentials to read subscription and cost data from your cloud provider. It also details the roles and permissions necessary.
Understanding the Virtual Machines page
The screenshot below shows an example of the data displayed on this page:
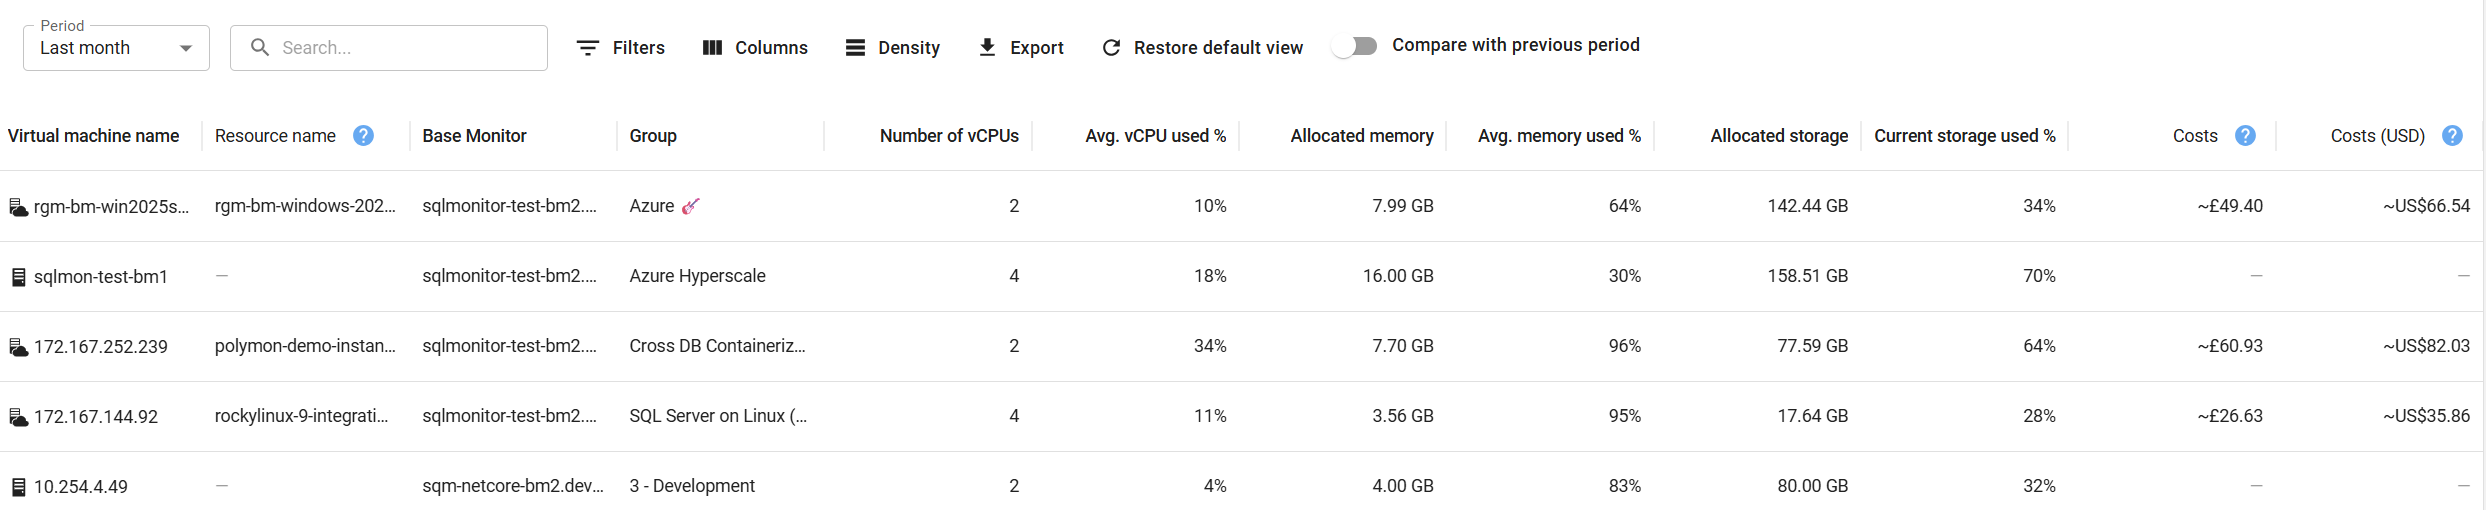
Page overview
This page lists every virtual machine detected in your estate, both on-prem and in the cloud, that hosts a monitored instance. For each machine, you can view various performance and capacity metrics averaged over a selected time period.
The Compare with previous period toggle compares the selected time period against an equivalent preceding period, displaying the difference for each virtual machine. For example, "Last 1 Month" compares the most recent 30 days against the previous 30 days. Your preference is saved and will be remembered when you return to this page. You can use the Period, Filters, Columns, and Density controls to customize the view and export data for further analysis.
Cloud Information
Custom DNS and Reverse Proxies can prevent Monitor from finding the matching Cloud Resource as the provider and monitor use different connection information.
If the cloud service credentials have been provided (see Managing cloud services) Monitor is able to retrieve subscription and cost details from your cloud provider.
Table columns
| Metric title | Metric description |
|---|---|
| Virtual machine name | The name or IP address of the virtual machine hosting one or more monitored SQL Server instances. |
| Base Monitor | The base monitor responsible for collecting data from this virtual machine. |
| Group | The group or category assigned to the machine in your SQL Monitor estate. |
| Number of vCPUs | The total number of virtual CPUs allocated to the virtual machine. |
| Avg. vCPU used | The average CPU utilization across the selected time period, expressed as a percentage. |
| Allocated memory | The total memory allocated to the virtual machine. |
| Avg. memory used | The average memory usage over the selected time period. |
| Allocated storage | The total allocated storage capacity for the virtual machine. |
| Current storage used | The current amount of storage used, expressed both in absolute size and as a percentage of total allocated storage. |
| Billed costs | The billed costs to date for the selected period, shown in both billed currency and USD. Billed costs represent the invoiced amount after discounts and reduced rates are applied, excluding amortized prepaid purchases. This follows the FOCUS™ Specification Billed Cost field |
| Effective costs | The effective costs for the selected period, shown in both billed currency and USD. Effective costs represent amortized costs after discounts, reduced rates, and applicable portions of prepaid purchases are applied. This follows the FOCUS™ Specification Effective Cost field |
Historical usage is averaged over the selected period (e.g., Last month).
If monitoring of a virtual machine is suspended, it remains in the list, but its values are shown as “–”.
Viewing Detailed Usage Information for Each Virtual Machine
To drill into the resource usage of a specific virtual machine, click on one of the Virtual Machines in the table. A side panel will appear, displaying additional information
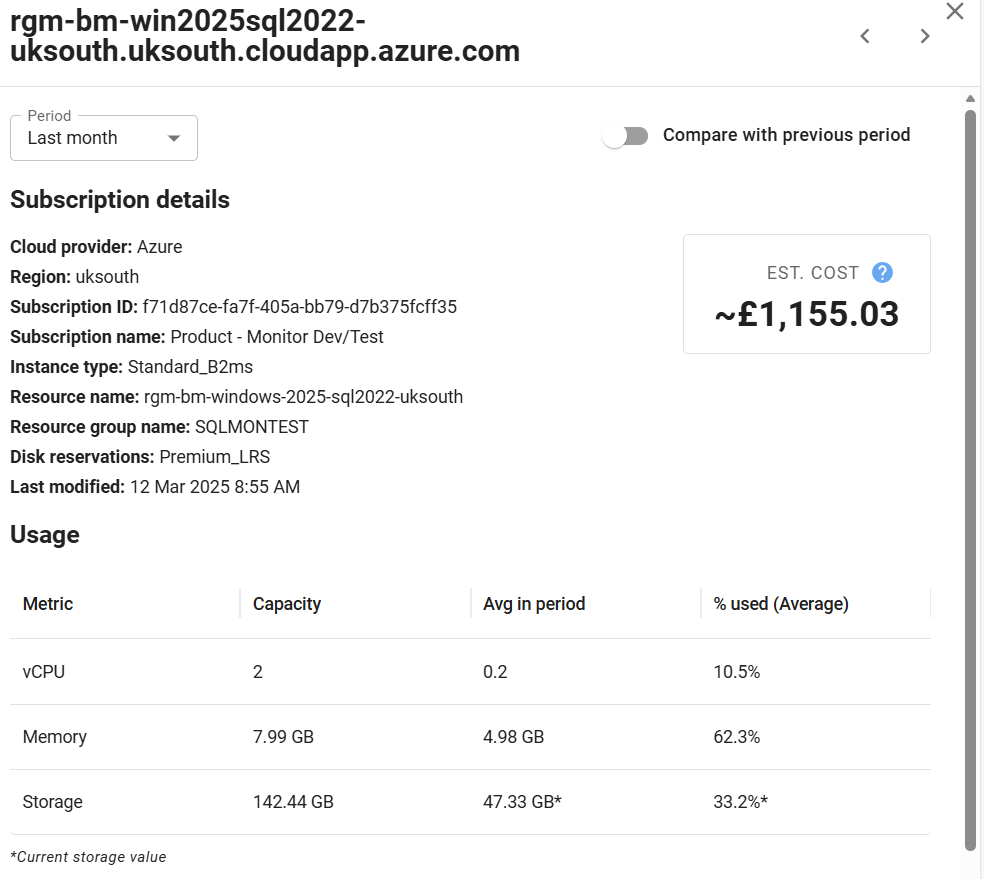
Subscription Details and Estimated Cost (for VMs hosted in supported cloud providers, and where Monitor has been provided access to those details. See Managing cloud services for further information)
Usage showing key metrics
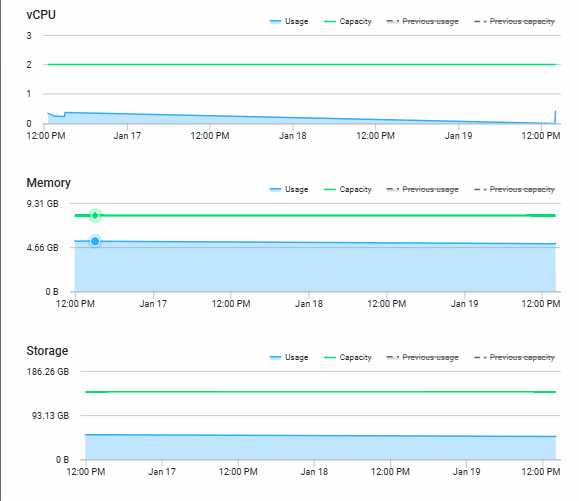
Charts
The side panel contains charts for:
vCPU usage and capacity
- Memory usage and capacity
- Storage usage and capacity
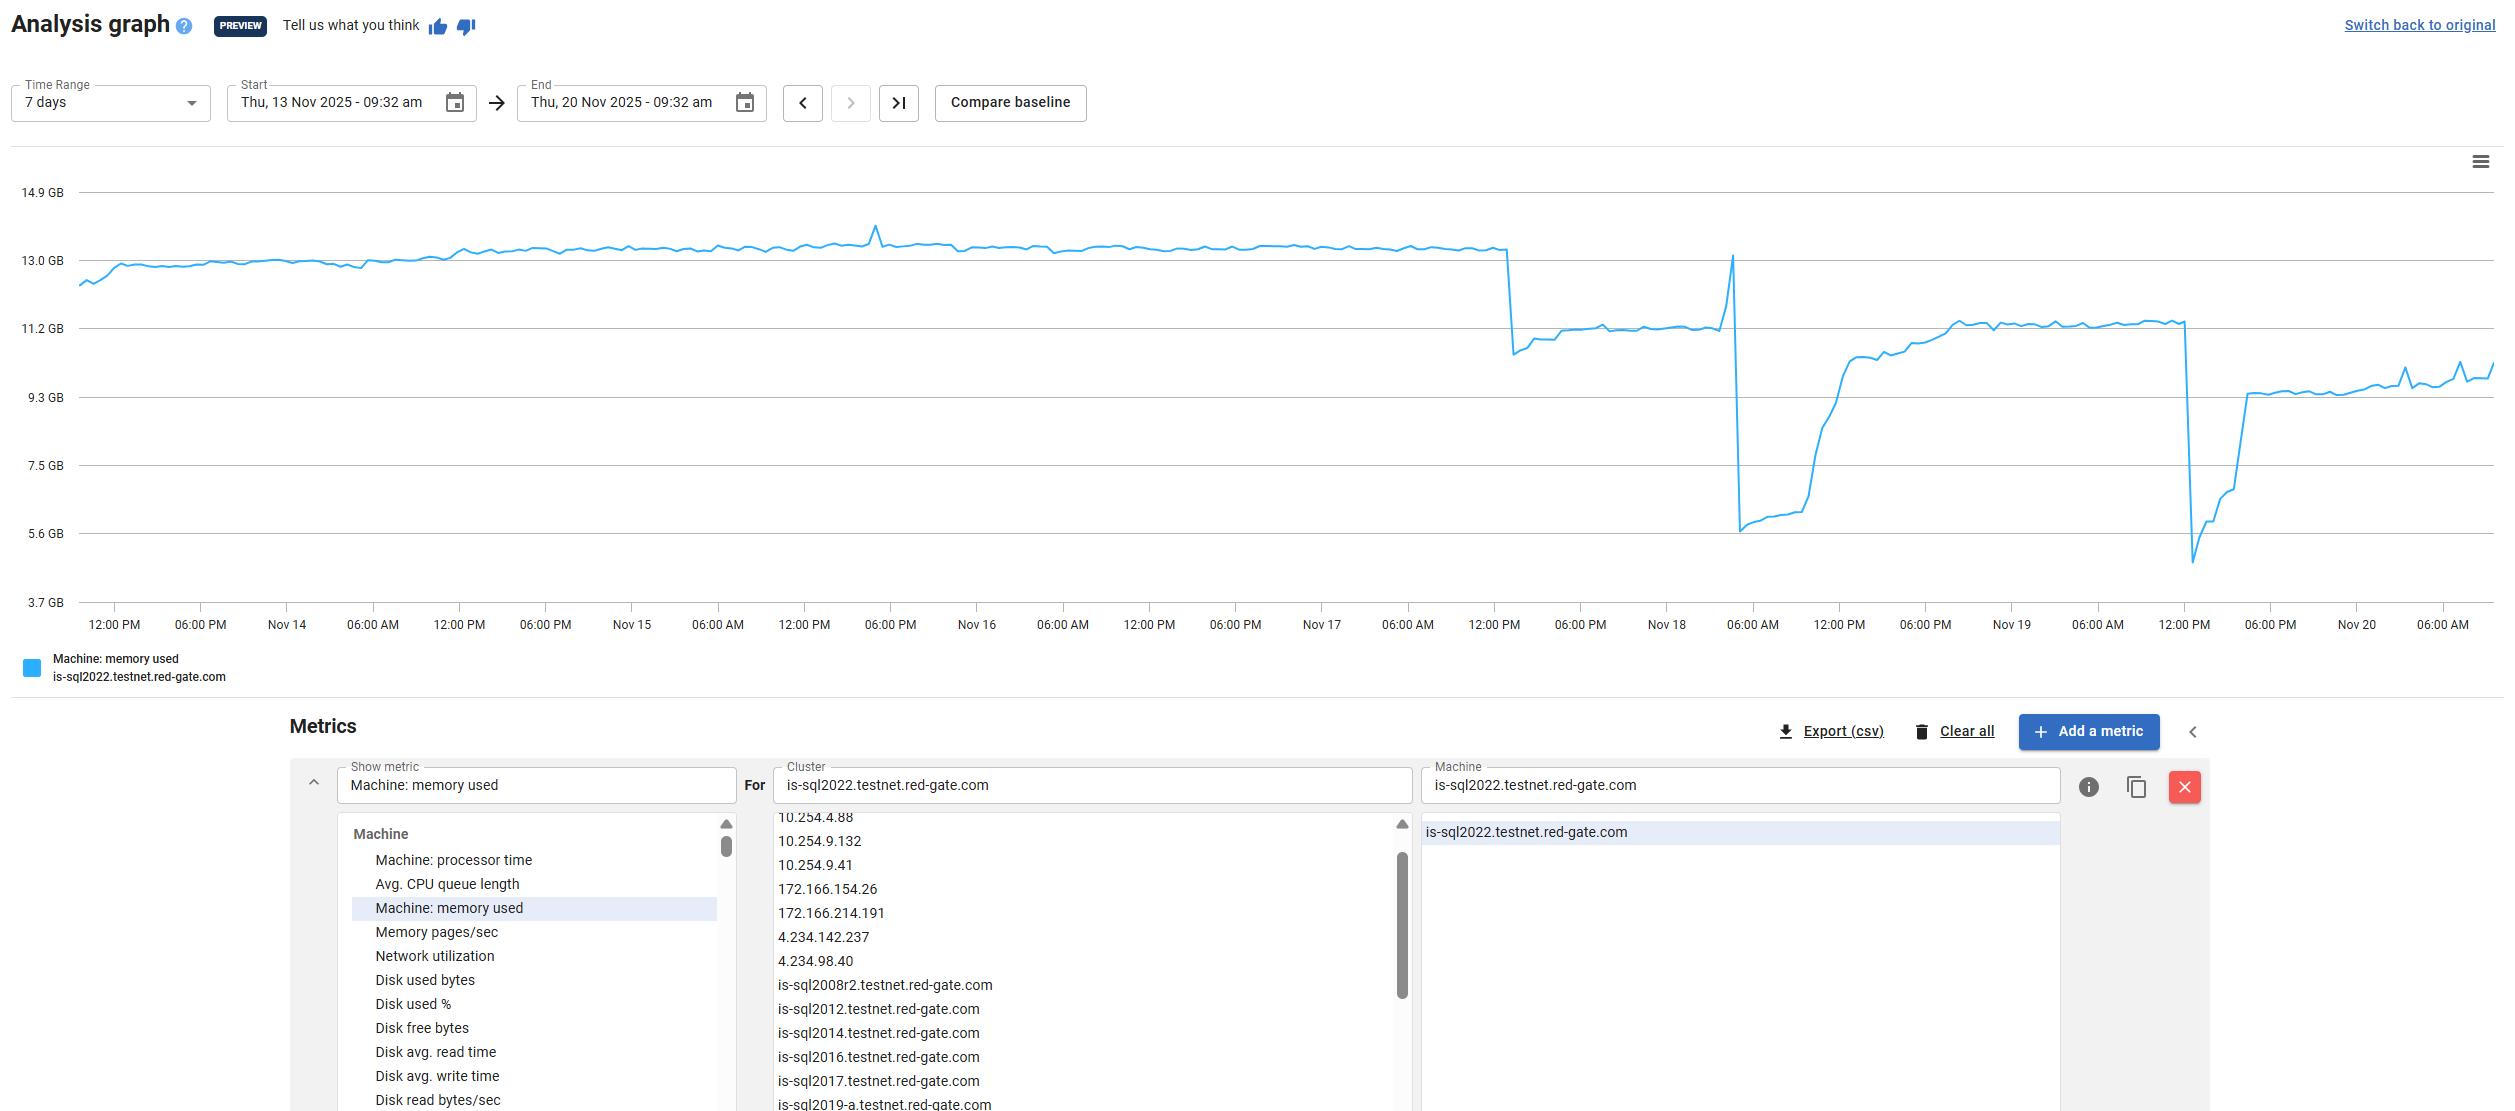
Deeper Analysis
Click on any line in the chart to open the Analysis page for the specific virtual machine, where you can explore trends and compare these metrics with other performance indicators.
This documentation contains proprietary information and is protected by copyright law.
Copyright © 2026 Red Gate Software Limited. All rights reserved


