Feature usage reporting analysis spreadsheet
Published 31 December 2012
A spreadsheet for Microsoft Excel is available that assists in your analysis of data from Feature usage reporting. The spreadsheet displays, for example:
- The mean number of sessions per day per active user.
- The mean and median total sessions per user.
- The mean, standard deviation and maximum number of uses per feature per session.
- The percentage of users who have used each feature.
- The percentage of users having different computer configurations.
- The percentage of users using each build, and how this has changed over time.
Note the following points:
- The spreadsheet requires Microsoft Excel 2007 or later.
- The spreadsheet analyzes information already stored in the SQL or .mdb database that stores your Feature usage data.
The spreadsheet does not connect to the web service to download the latest Feature usage data. To obtain the latest Feature usage data before you use the spreadsheet, use SmartAssembly to download the latest Feature usage reports to your database. For more information, see Viewing Feature Usage Reports.
- Some features in the spreadsheet are unavailable if your Feature usage reporting data is stored in a .mdb file.
You can download the spreadsheet here.
User System worked example
The User System worksheet shows the proportion of your end users who have different operating systems and versions of .NET installed. You can also analyze the number of users having a specific monitor resolution, OS bitness, culture, or timezone.
This information can be useful to determine when you can target a newer version of .NET, for example.
- On the Project Summary worksheet, select the Project you are interested in, then click Refresh Sheet.
- On the User System worksheet, click Refresh Sheet.
- The worksheet updates to display the User System information for the project.
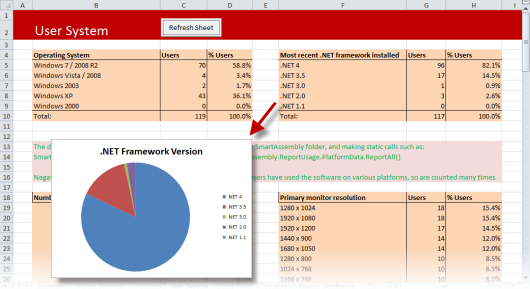
Only 3.5% of users would be inconvenienced if you decide that future versions of your application will require .NET 3.5.
Versions worked example
The Versions worksheet shows the number of users who use each different build of the selected project, and how the numbers have changed over time.
You can use this information to check how many users have yet to upgrade to a specific build:
- On the Project Summary worksheet, select the Project you are interested in, then click Refresh Sheet.
- On the Versions worksheet, click Refresh Sheet.
- Change the Time step (days) to ensure that there is neither an excessive, nor an insufficient quantity of data displayed. We recommend the following values:
- If your product was released within the last month, set the Time step (days) to 1.
- If your product was released within the last 3 months, set the Time step (days) to 2.
- If your product was released within the last 6 months, set the Time step (days) to 7.
- If your product was released within the last 12 months, set the Time step (days) to 14.
- The worksheet updates to show how many sessions have been run using each build, and how many times each build was used over time.
The granularity of this data is determined by the value set for Time step (days).
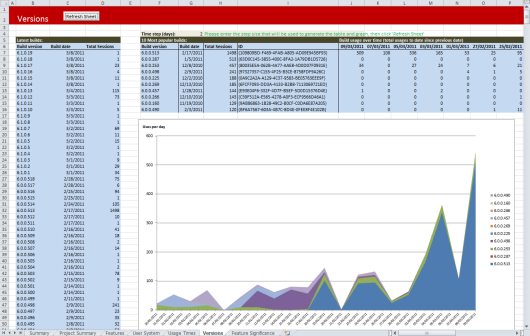
The number of users still running build 6.0.0.253 is decreasing as they upgrade to build 6.0.0.513.
From this data, you can extrapolate the date by when all users of older builds are likely to have upgraded.
This documentation contains proprietary information and is protected by copyright law.
Copyright © 2026 Red Gate Software Limited. All rights reserved


