Viewing feature usage reports
Published 31 December 2012
This page explains how to view feature usage reports submitted by your end users. To receive feature usage reports, you must first add feature reporting code to your application, and then enable it in the SmartAssembly project. For more information on setting up feature usage reporting, see Setting up feature usage reporting.
When a feature usage report is received by the web service, a counter increments showing that the feature has been used. You use SmartAssembly to view the usage counters and to export the data to a spreadsheet.
Note that viewing and exporting the counter data does not reset the counters.
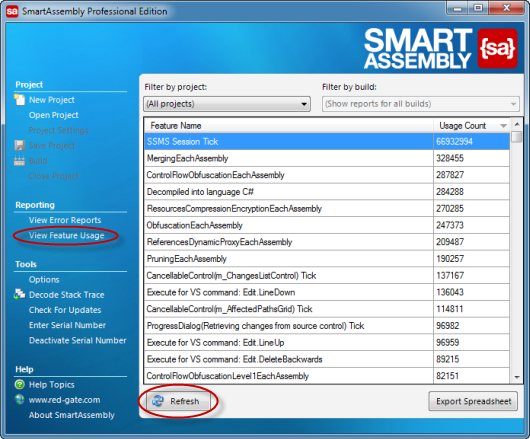
To view the feature usage counters, on the menu bar, click View Feature Usage. The latest counter data is downloaded automatically.
To update the counters while viewing them, click Refresh.
Filtering reports by project and build
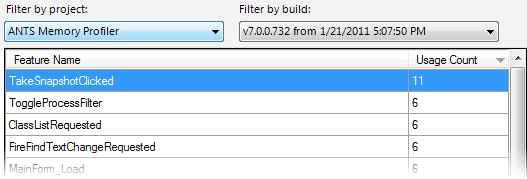
If you have built multiple projects with SmartAssembly but you only want to see the feature usage reports for one of them, select it from the Filter by project menu. Reports relating to other projects are hidden. To view reports for all projects, on the Filter by project menu select (All projects).
To filter reports by a build, use the Filter by project menu to select the project, and then select the build on the Filter by build menu. To view reports for all builds, on the Filter by build menu select (Show reports for all builds).
Exporting feature usage data
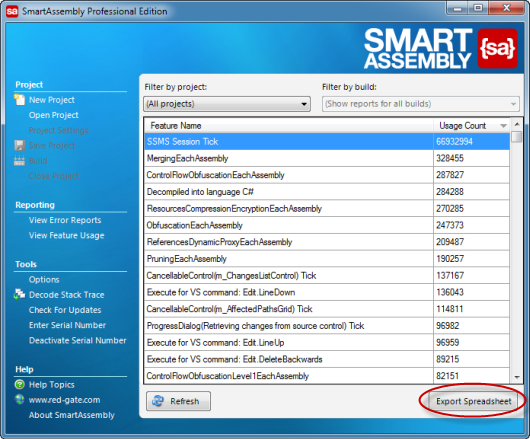
To export the feature usage data as a CSV file, click Export Spreadsheet.
The CSV export provides more detail than the counters alone. The following fields are provided:
User ID | A GUID based on the Windows user SID of the user who ran your application. |
Session ID | A GUID that is unique each time your application is run. |
Session Date | The time when your application was run on the end user's computer. |
Feature Name | The string passed to |
Usage Count | The number of times the feature was used during that user's session. |
As a simple example, imagine that:
- User 1 ran your software on computer X at 12:34pm on 23 January 2011. During that session, the user used Feature A, Feature B, and Feature C.
- At 12:58pm on the same date, User 2 ran your software on computer Y. During that session, the user used Feature B, Feature C (twice), and Feature D.
- Later that day, at 3:45pm, the first user loaded your software on computer X again, and then used Feature A ten times and also Feature D.
If you click Refresh after User 1 has closed the application, and then you click Export Spreadsheet, the exported CSV file would look something like this:
User ID | Session ID | Session Date | Feature Name | Usage Count |
1 (GUID) | GUID | 1/23/2011 12:34:00 PM | Feature A | 1 |
1 (GUID) | GUID | 1/23/2011 12:34:00 PM | Feature B | 1 |
1 (GUID) | GUID | 1/23/2011 12:34:00 PM | Feature C | 1 |
2 (GUID) | GUID | 1/23/2011 12:58:00 PM | Feature B | 1 |
2 (GUID) | GUID | 1/23/2011 12:58:00 PM | Feature C | 2 |
2 (GUID) | GUID | 1/23/2011 12:58:00 PM | Feature D | 1 |
1 (GUID) | GUID | 1/23/2011 3:45:00 PM | Feature A | 10 |
1 (GUID) | GUID | 1/23/2011 3:45:00 PM | Feature D | 1 |
For more detailed analysis, see Feature usage reporting analysis spreadsheet.
This documentation contains proprietary information and is protected by copyright law.
Copyright © 2026 Red Gate Software Limited. All rights reserved


