Server Overview pages
Published 07 October 2020
SQL Monitor analyzes the collected metric and alert data, and presents, on each Server Overview page, a detailed graphical overview of resource usage, server and user activity and alerts over time. You can correlate this information directly with the behavior of relevant performance counters, wait statistics, query execution details, server properties and more. Its interactive graph, with baselines, along with metric sparklines, wait statistics, query details and other diagnostic data, will not only help you to diagnose alerts quickly, but also allow you to spot unusual usage patterns or worrying trends across any or all the monitored SQL Servers, and to act before they escalate into problems that affect the service and integrity of the application.
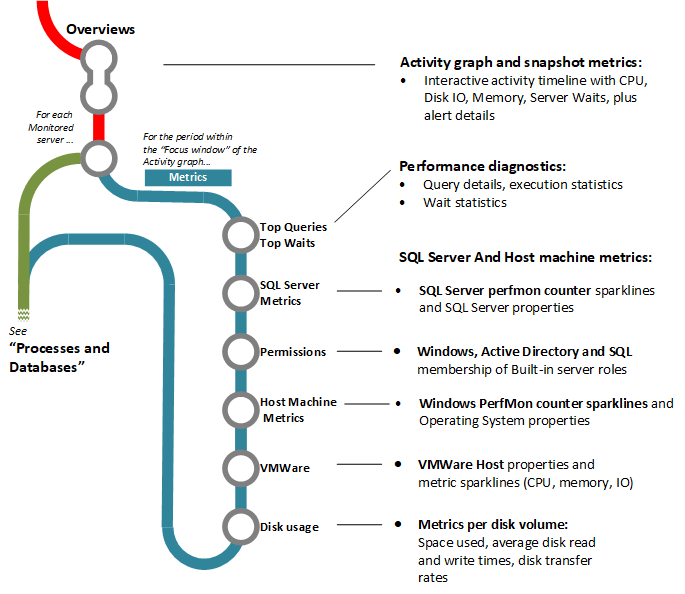
- Activity Graph and Snapshot Metrics
- Performance diagnostics: queries and waits
- SQL Server and host machine metrics
- Processes and databases
- Tempdb
Next step
This documentation contains proprietary information and is protected by copyright law.
Copyright © 2026 Red Gate Software Limited. All rights reserved


