Tempdb
Published 15 October 2020
SQL Monitor presents a range of information to help you understand both usage of tempdb and performance problems that might arise from it.
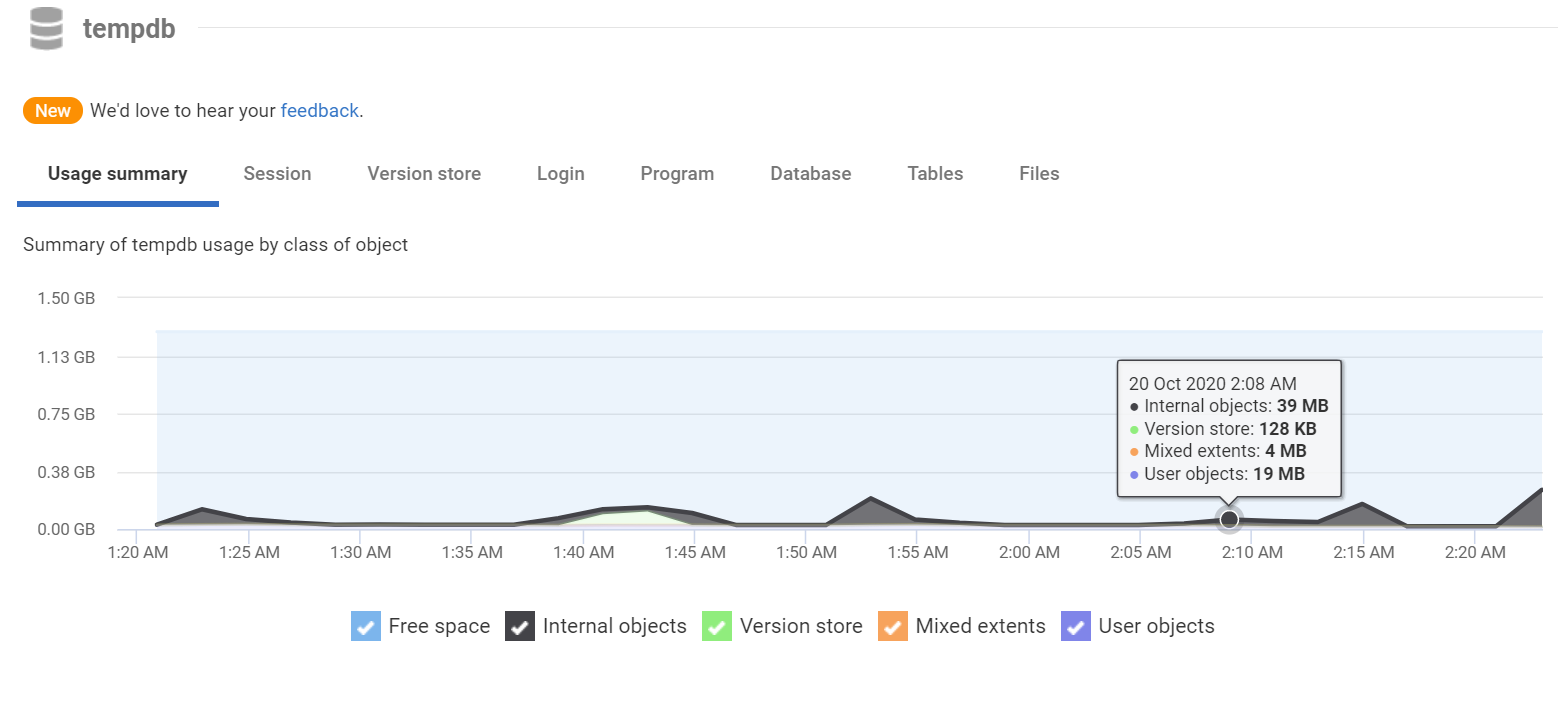
The summary graph shows the distribution of space and usage in tempdb over time. You can use it to track changes in the total allocated size of tempdb and to identify what areas are using the most space.
- Free space is space that has been allocated and is not currently in use. Jumps in this might indicate, for example, autogrowth of tempdb, and might be correlated with high disk activity if instant file initialization is not enabled.
- Internal object space is space used by SQL Server, for example due to a sort operation spilling into tempdb during the evaluation of a query.
- User space is space allocated for temporary tables and table variables.
- The version store uses tempdb to provide snapshot-level isolation.
- Mixed extents might contain internal or user objects. Since the SGAM can be a point of contention, from SQL Server 2016, these should not be seen within tempdb. See Recommendations to reduce allocation contention in SQL Server tempdb database
The session graph and table shows how individual sessions are using tempdb. This can be used to help you identify individual queries that are active within tempdb, for example a long-running analytic query that spills into tempdb. The login, application and database graphs aggregate session-based information to individual logins, applications and databases respectively.
The version store graph shows tempdb usage for the version store by database, allowing you to identify any database that is particularly responsible for tempdb usage to provide snapshot-level transaction isolation. This page also provides graphs showing the rate in bytes/second at which rows are being added to the version store (the generation rate) and the rate at which rows are being removed (the cleanup rate). These metrics allow you to see both the amount of I/O being generated by snapshot isolation and its effect on tempdb usage. The final metric is the longest running transaction time: the version store cannot be cleared whilst any transaction is active.
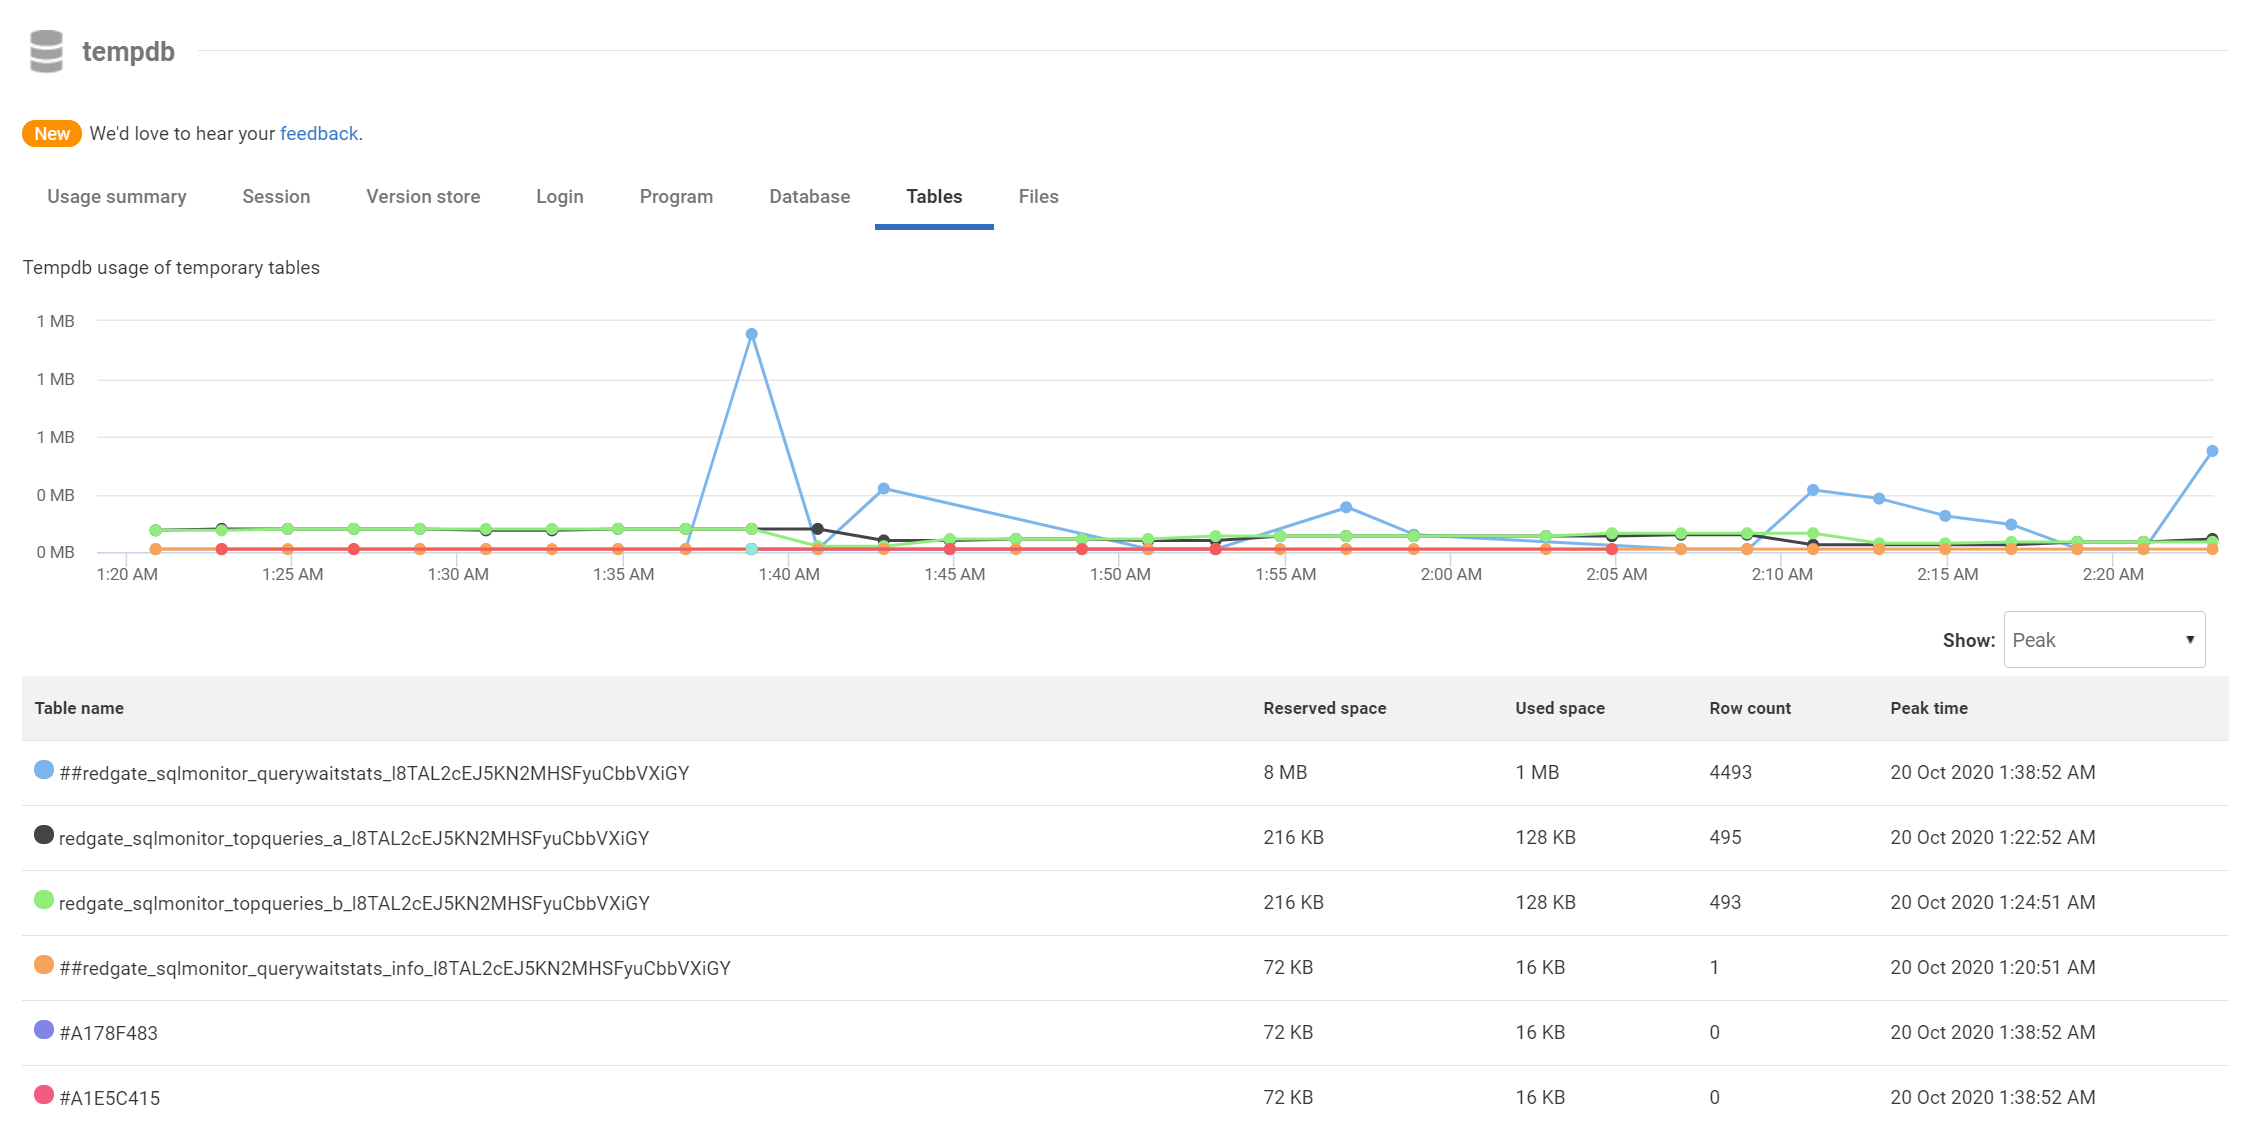
The tables area shows the sizes of user tables within tempdb and how they change over time. The table can show either the average usage during the selected window or the peak usage within the window. This can allow you to identify what particular user object might be consuming tempdb space.
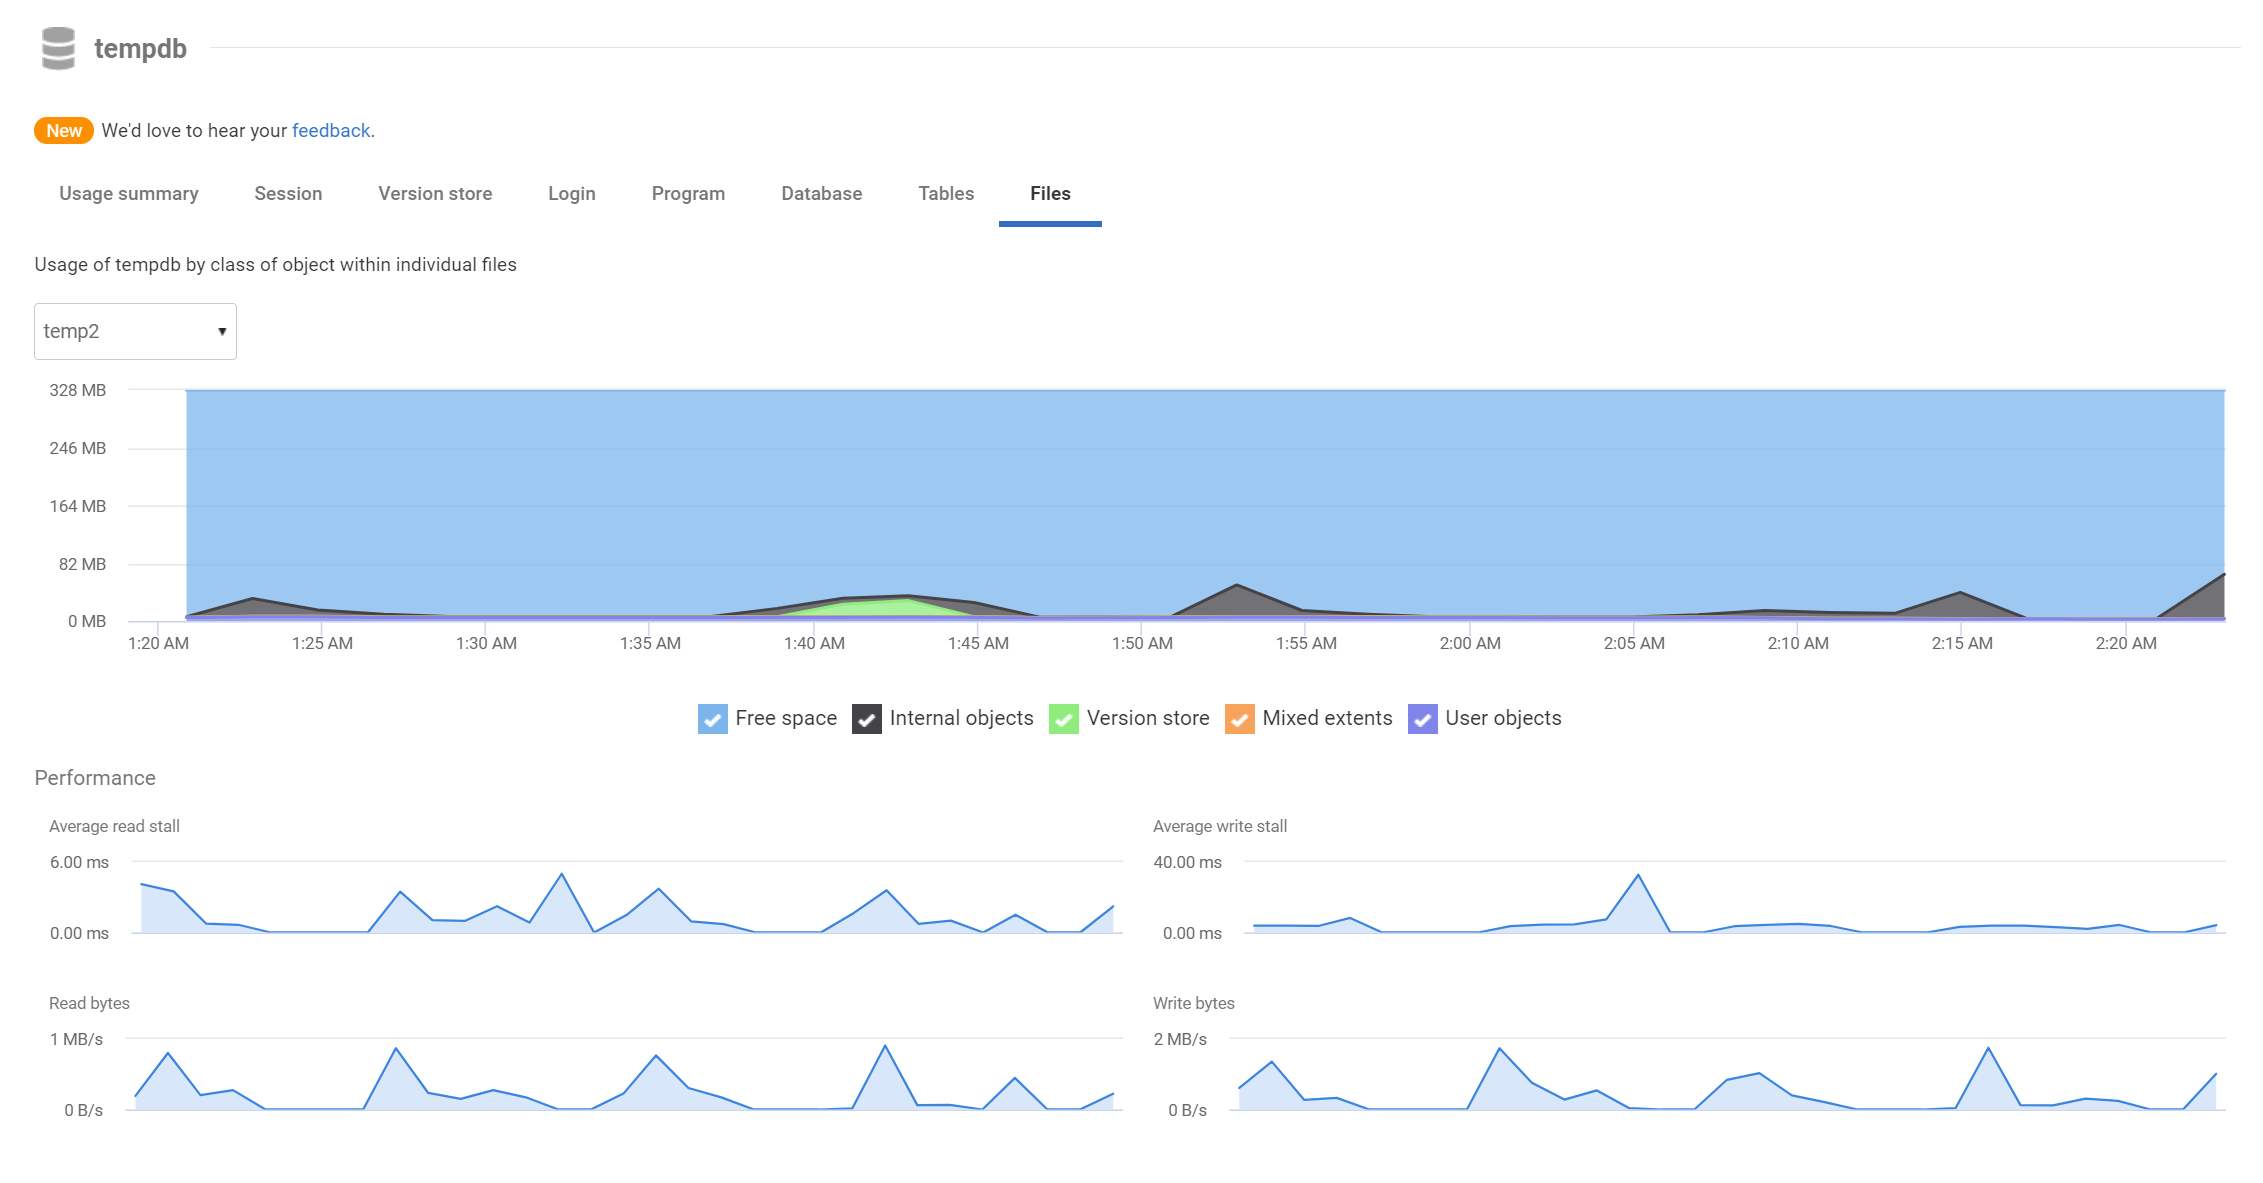
The files area provides graphs showing the usage within each individual tempdb file. Normally, you would expect to see a similar pattern of usage and size for each file. This section also provides aggregate and per-file graphs to show both the average amount of time read and write operations stall (wait). Using this information, you might identify that a particular file is responsible for the significantly more read/write stalling than other files; this would lead to further investigation of the distribution of data between tempdb files as well as the file's underlying storage.
For some ideas on how to use this page, and other information in SQL Monitor, to diagnose tempdb issues, plus some best practices for resolving them, see Is tempdb usage causing performance problems?
This documentation contains proprietary information and is protected by copyright law.
Copyright © 2026 Red Gate Software Limited. All rights reserved


