Dashboards and Overviews
Published 07 October 2020
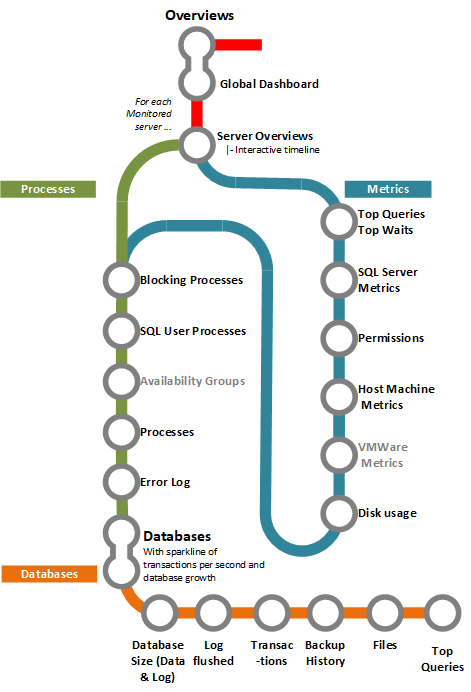
The Overviews section is to SQL Monitor what the Central line is to London, or the A-train to New York City. It is where you can review any problems that arise, directly within the context of server activity over that period. It consists of the Global Dashboard, which is the default front page for SQL Monitor and the Server Overview page, for each monitored server. There are also separate overview pages for availability groups and clusters.
Next step
This documentation contains proprietary information and is protected by copyright law.
Copyright © 2026 Red Gate Software Limited. All rights reserved


