Indexes
Published 06 November 2023
This feature is disabled by default due to high memory usage on the Base Monitor machine when a large number of indexes are present.
You can enable it by turning on the Indexes feature flag. To do so, set the environment variable SQLMONITOR_Indexes to on (or off to explicitly disable it). This needs to be done on the host machines for both the Website and any Base Monitors you wish to sample indexes on.
In order for the change to take effect, you will need to restart your SQL Monitor Base Monitor and the SQL Monitor Web services.
SQL Monitor collects information about indexes on your monitored servers. This information is made available on the server overview's indexes tab.
Indexes affect the speed of access of information on the tables and views that they exist on. Having missing indexes could result in slow queries when reading data, whilst having underused indexes can unnecessarily slow down writes.
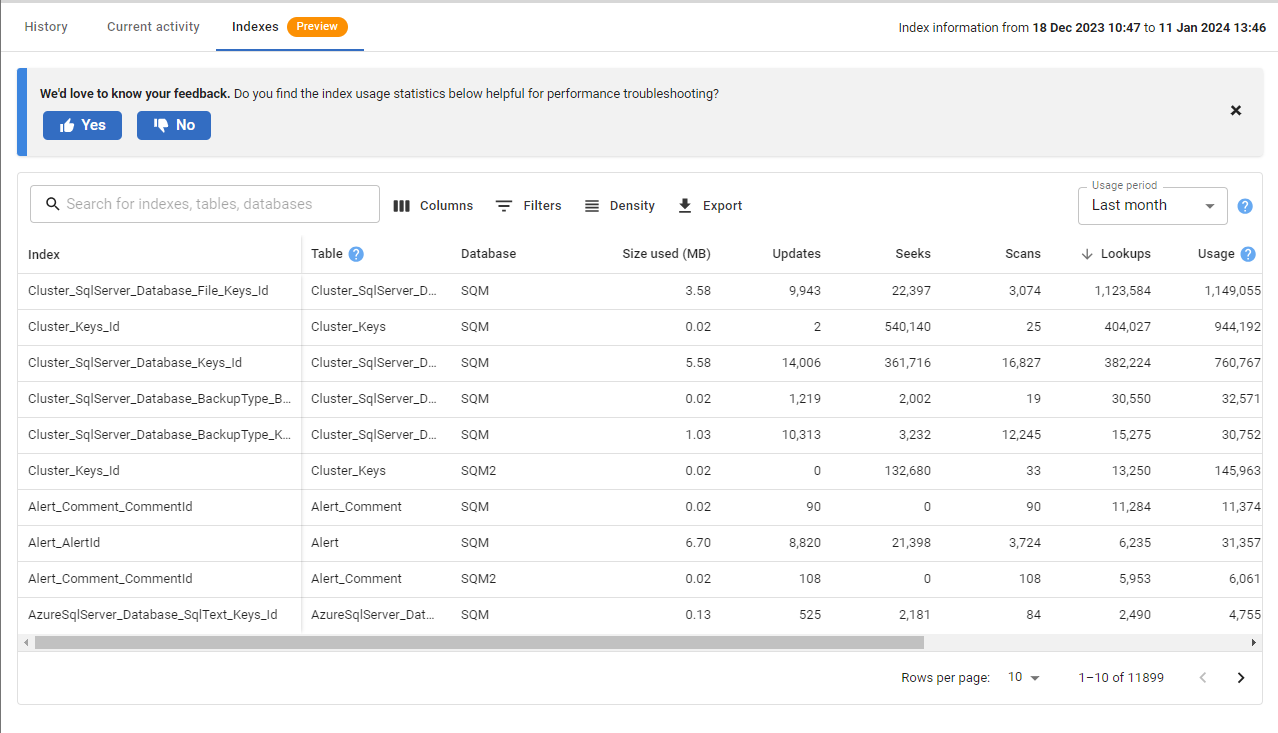
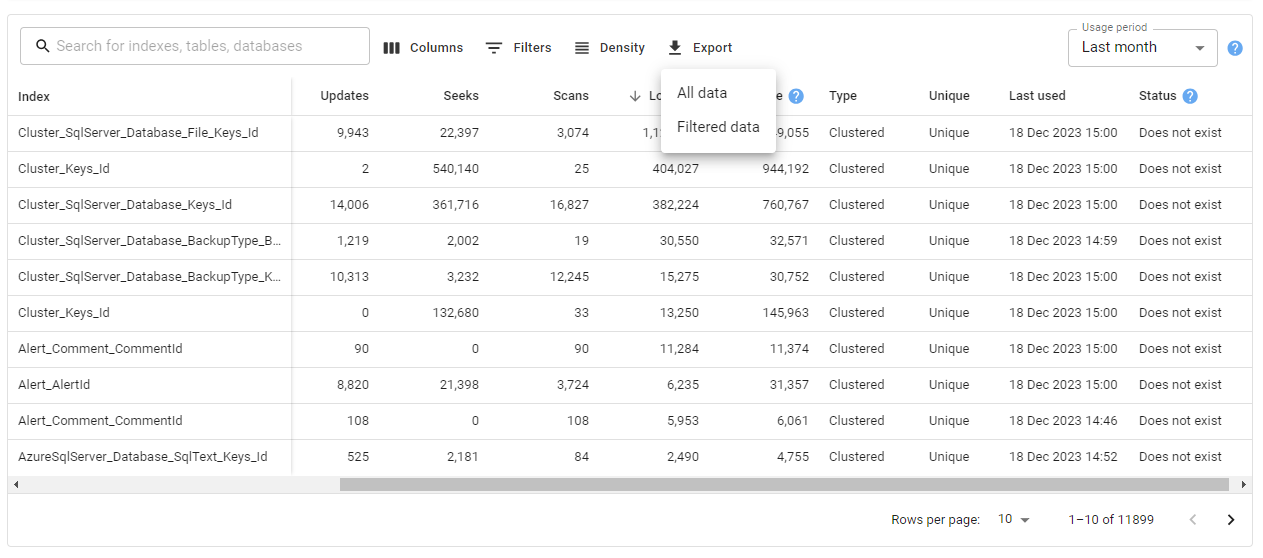
Indexes table
The indexes table shows all indexes that exist on your SQL Server instance except those on the master, msdb and model databases or those under system and internal tables.
This includes currently existing indexes and those that have historically existed in the selected time period, as denoted by the status column.
Information shown in the table includes:
- Identifying information (name, parent object and database)
- Usage information (size on disk, updates, seeks, scans and lookups)
- Configuration information (type, unique)
Filtering
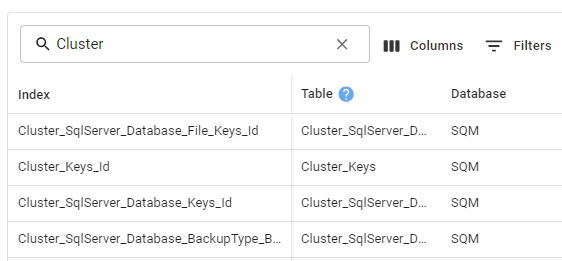
The table has built-in filtering functionality, including a general search bar and column filters.
The search bar allows you to quickly find indexes by searching for partial matches within the Index, Table and Database columns.
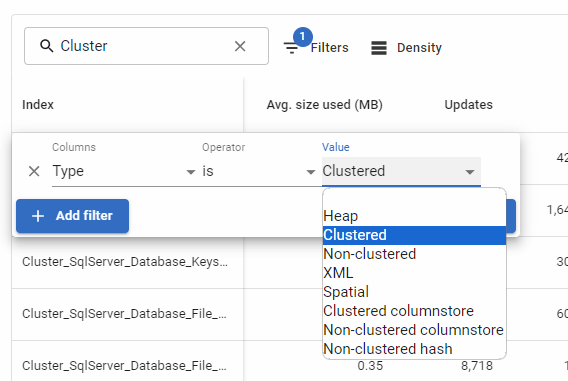
More tailored filters can be added either using the Filters button...
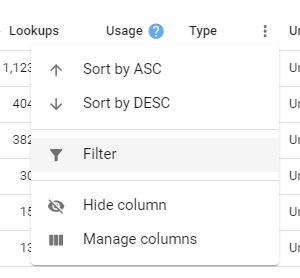
...or via the column menu
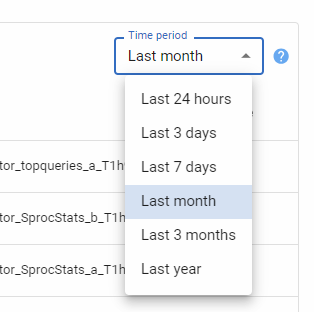
Time period
The time period filter allows you to view aggregated usage statistics over different time periods.
Changing the value of this filter will cause the index table information to be re-fetched from the SQL Monitor repository. Setting a large time period value may result in slower load speeds for the indexes table data.
The top ribbon of the indexes tab displays the actual starting and end points of the indexes data retrieved for the server.
This date range may not match the time period for one of the following reasons
- SQL Monitor has not been collecting data for as long as the time period selected
- Your data retention settings are set to clear out index data more frequently than the time period selected
- The index information was not collected recently, as the default collection frequency from the server is every 24 hours
Exporting data
You can export data from the indexes table using the Export button.
Clicking the button will show a menu giving you two export options:
- All data - Export all rows regardless of applied filters
- Filtered data - Export rows as filtered in the table
Both options:
- Export all columns, regardless of whether they are visible or not
- Export data across all pages, not just the currently viewed one
- Are sorted as seen in the table
Not all columns will have their exported data match in format to that seen in the table. This is mostly done to make the data more computer-ingestible. For example, the exported dates will be in ISO 8601 format.
Sidebar
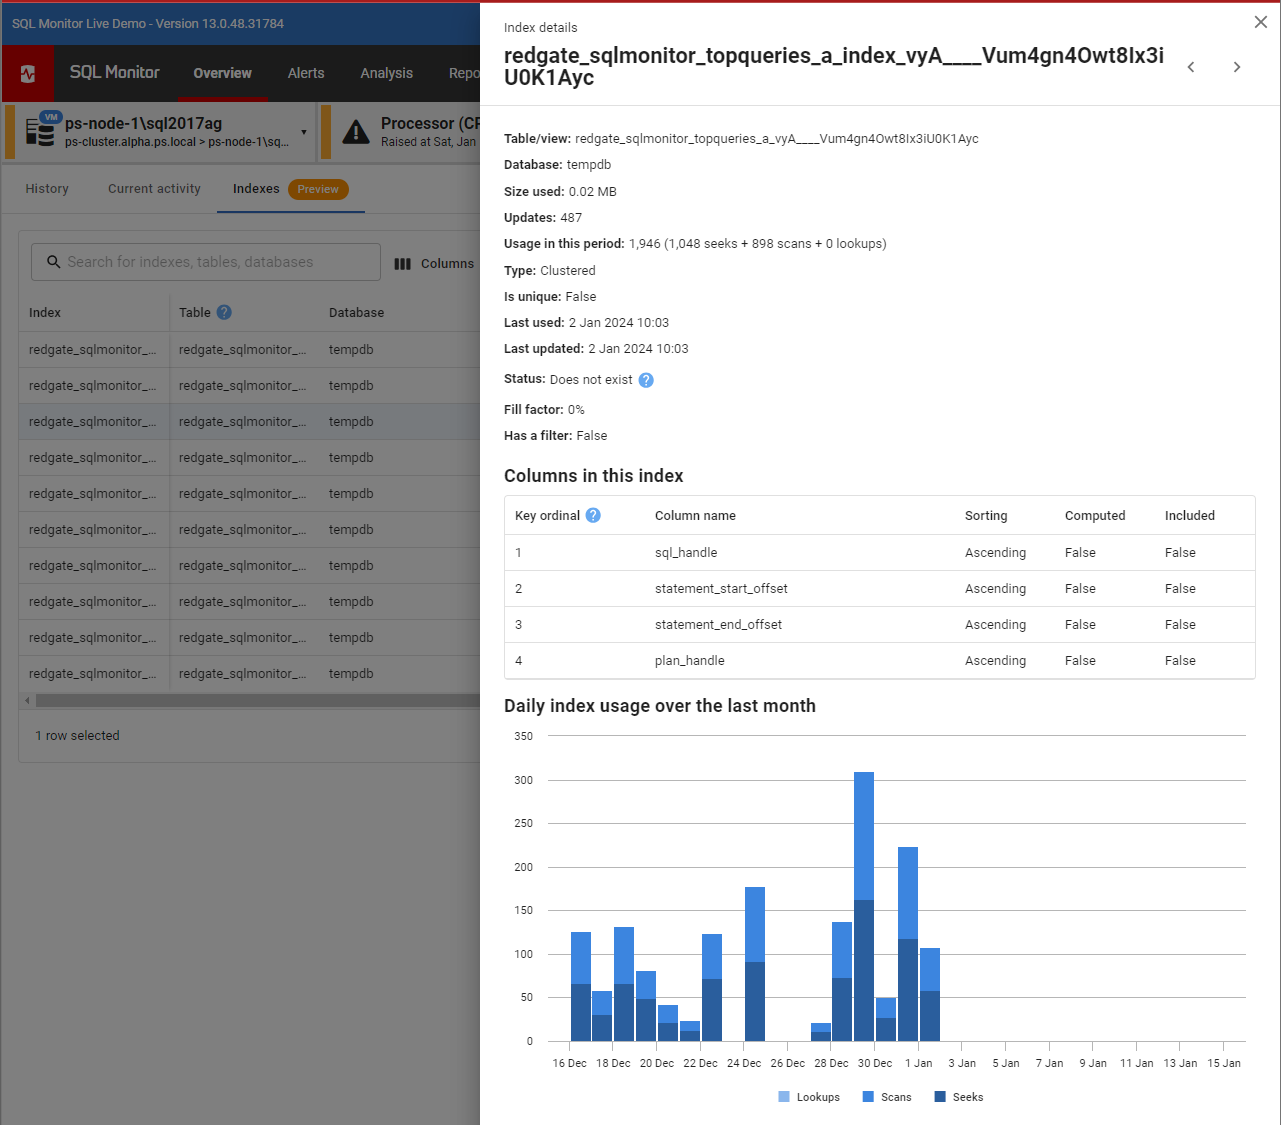
You can click on an index on the table to see more information about that index. This will open a sidebar as shown below.
The first section shows the same details as the table, plus a few extra statistics.
The columns table shows the columns referenced by this index ordered by key ordinal.
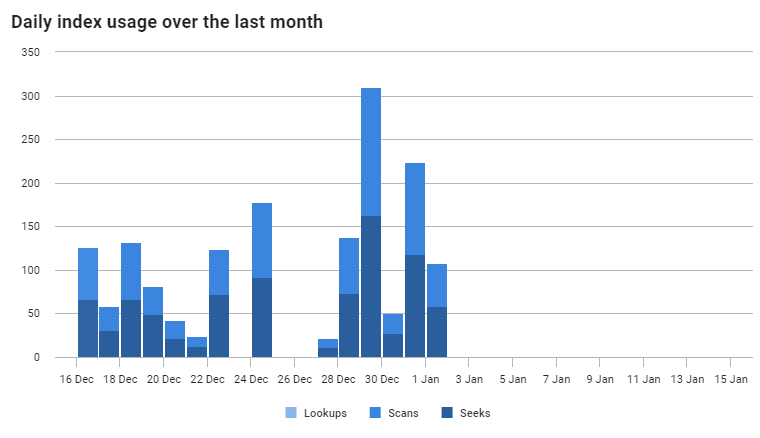
Index usage graph
The final section contains a graph showing index usage over the last month. This is broken down into seeks, scans and lookups.
