Example configuration using virtualization software
Published 31 January 2017
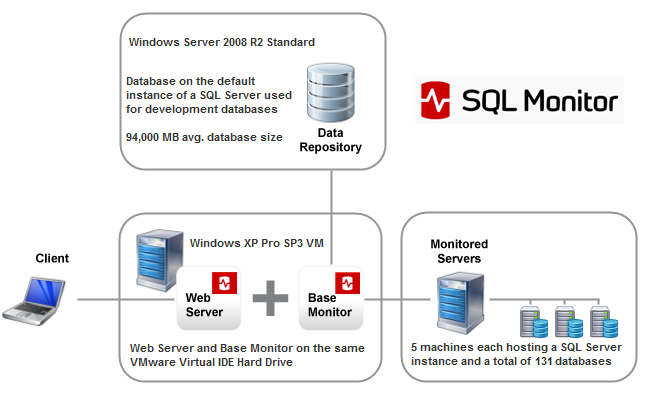
The network configuration described below is a working example of how SQL Monitor has been deployed by John Henderson, DBA and Senior Programmer at Smith Travel Research (STR).
Base Monitor and Web Server configuration
The Base Monitor runs the service that monitors your machines and instances. The Web Server delivers the pages for the SQL Monitor web interface. In this configuration, the Web Server and Base Monitor are on the same VMware Virtual IDE hard drive of a machine running Windows XP Pro SP3 VM with .NET 3.5 SP1 installed.
- Physical memory: There is 2 GB of physical memory on the machine. The RAM utilization is:
Base Monitor - RedGate.Response.Engine.Alerting.Base.Service.exe = ~320 MB
Web Server - RedGate.Response.UI.Server.Service.exe = ~16 MB
- Processor: There are 2 cores allocated to the VM, with the operating system handling processor distribution.
The Base Monitor service uses default TCP port 7399 to communicate with the Web Server.
The Web Server is SQL Monitor's own standalone self-contained Web Server that uses .NET 3.5 runtime and default TCP port number 8080 for incoming connections. The client machines accessing the Web Server are using mostly Firefox 4.0 but occasionally Internet Explorer 8 and Chrome 12 Development Channel. Firefox is preferred because earlier version of SQL Monitor rendered much more consistently in this browser, although more recent versions render just as well on Chrome.
Data Repository configuration
The Data Repository is an MS SQL Server database that stores the data collected by the Base Monitor service. In this configuration, the Data Repository database runs as the default instance on a MS SQL Server 2005 64-bit (x64) Enterprise database. The machine is running Windows Server 2008 R2 Standard with .NET version 2.0 to 4.0 installed. There are other development databases hosted on this machine, but there is sufficient memory and processor capacity to accommodate this:
- Physical memory: The total available RAM is 8 GB
- Processor: There are 4 x 3 GHz dual cores available
Monitored servers
This configuration contains five machines each hosting a SQL Server instance with a total of 131 databases across all instances. A breakdown of machines, instances and databases being monitored is as follows:
- Machine A hosting 1 SQL Server instance and 14 databases
- Machine B hosting 1 SQL Server instance and 28 databases
- Machine C hosting 1 SQL Server instance and 37 databases
- Machine D hosting 1 SQL Server instance and 16 databases
- Machine E hosting 1 SQL Server instance and 36 databases
One of the machine is in a DMZ, so there is a firewall between it and the Base Monitor. TCP ports 135, 445 and 1433 have been opened to allow remote file access and WMI access.
Performance, trace and purge settings
The following metrics obtained from SQL Monitor’s Analysis page give an idea of how busy the SQL Server instances are on average in this network for the last 30 days.
| SQL Monitor metric | Equivalent Performance Monitor counter | Example value |
SQL Server: processor time | Process (sqlservr): % Processor Time | 11.22% |
SQL Server: user connections | SQLServer: General Statistics: User Connections | 45 |
Transactions per second | SQLServer:Databases - Transactions/sec | 40.26 |
The average metrics for each instance are:
SQL Server: processor time | SQL Server: user connections | Transactions/sec | |
Machine A | 11.8% | 23.5 | 11.5 |
Machine B | 10.0% | 87.4 | 02.3 |
Machine C | 10.8% | 52.7 | 09.7 |
Machine D | 12.3% | 77.5 | 05.1 |
Machine E | 11.5% | 21.6 | 12.7 |
Trace data collection is enabled and used to track down potential causes of blocks and long running queries, and for general troubleshooting.
Finally, the DBA wants to do 90 days’ worth of trending, but they need to make sure that the Data Repository growth rate does not impact performance. The purge settings have been customized as follows:
- Machine Data: 3 months
- Alert Data: 2 weeks
- SQL Server Data: 3 months
This documentation contains proprietary information and is protected by copyright law.
Copyright © 2026 Red Gate Software Limited. All rights reserved


