SQL Monitor data retention policy
Published 08 March 2018
SQL Monitor stores a large amount of data in its Data Repository. To prevent the Data Repository database using all your hard disk space, SQL Monitor checks for old data every hour and deletes data older than the time specified for each category.
Configuring data retention
Go to the Configuration tab. Under Data management, select Data retention:
Data is stored in two categories: data you’ll want to view trends for, and performance troubleshooting data. You can choose how long to keep various types of data in the Data Repository. We recommend storing data that you'll want to view trends for over time for longer than performance troubleshooting data, which you're more likely to need only in the short term.
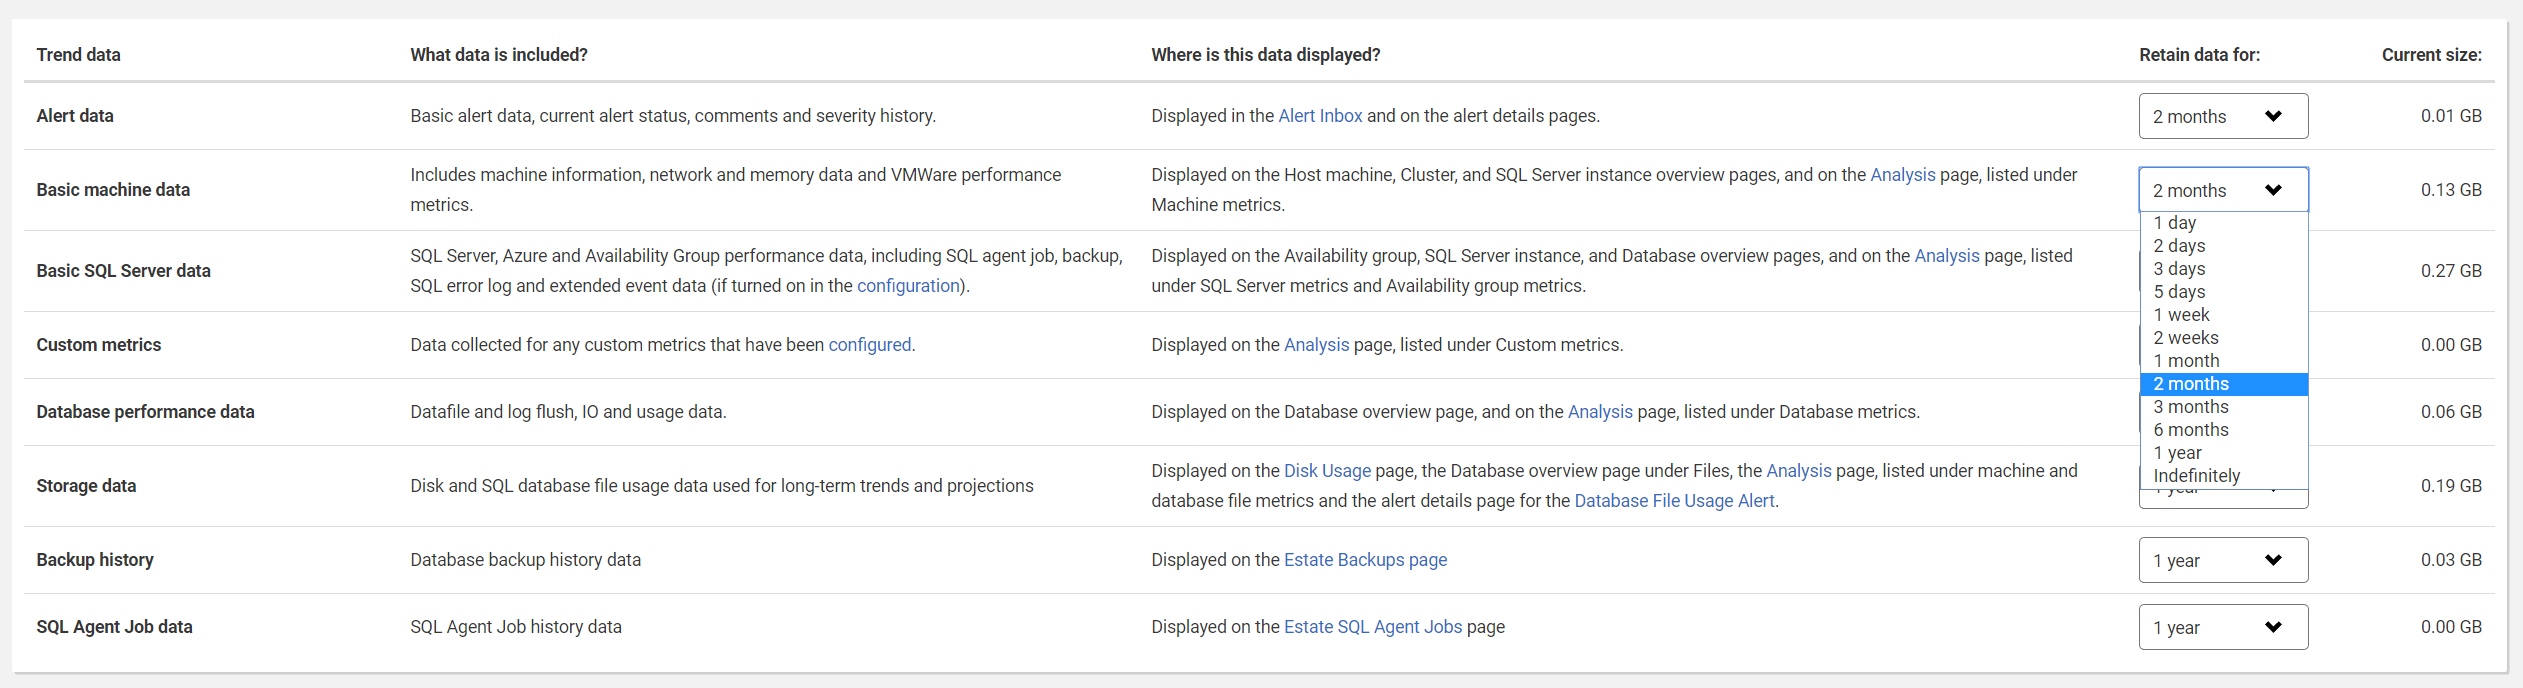
The default data retention setting for each type of data is displayed in brackets:
- Data you'll want to view trends for
- Alert data (2 months) - Displayed in the Alert Inbox and on the alert details pages.
- Basic machine data (2 months) - Displayed on the Host machine, Cluster, and SQL Server instance overview pages, and on the Analysis page, listed under Machine metrics.
- Basic SQL Server data (2 months) - Displayed on the Availability group, SQL Server instance, and Database overview pages, and on the Analysis page, listed under SQL Server metrics and Availability group metrics.
- Custom metrics (2 months) - Displayed on the Analysis page, listed under Custom metrics.
- Database performance data (1 week) - Displayed on the Database overview page, and on the Analysis page, listed under Database metrics.
- Storage data (1 year) - Displayed on the Disk Capacity Planning page, the Database overview page under Files, the Analysis page, listed under machine and database file metrics and the alert details page for the Database File Usage Alert.
- Performance troubleshooting data
- SQL process data (2 weeks) - Displayed on the SQL Server instance overview page under SQL user processes (top 10 by CPU usage), and on the alert details pages under Details (when trace is turned off).
- SQL top queries data (1 week) - Displayed on the SQL Server instance and Database overview pages under Top waits and Top queries, and on the alert details pages under Performance Data.
- SQL query plans data (1 week) - Displayed on the SQL Server instance and Database overview pages under Top waits and Top queries.
- Windows process data (1 week) - Displayed on the Host and Cluster machine overview pages under System processes (top 10), and on the alert details pages under System processes.
- SQL trace data (3 days) - Displayed in the Performance Data section of the alert details pages, under SQL processes/Profiler trace.
The default data retention settings are designed to keep the data you're most interested in for longer without using up too much disk space. To change these settings, select a different time limit from the drop-down list for each category and click Save settings.
How should I set my data retention policy?
Your data retention policy depends on:
- how important it is for you to retain historic information about each category. For example, for auditing purposes, you may need to keep data about your machines for longer than alert data.
- the amount of disk space you have available in your Data Repository to store collected data. If space is an issue, you may consider deleting high volume data on a more frequent basis.
There is an option to retain data Indefinitely for each category, which means data in your Data Repository will never automatically be deleted, but you should ensure that you have enough disk space available to accommodate potentially high volumes of data.
The current size occupied by the data tables and any related indexes in each category is displayed in the table. The current total size of all categories is also shown.
How does SQL Monitor treat data that has been deleted?
- For overview data, a dash ( - ) will be displayed on the overview pages next to a value if you rewind to a point in time for which data no longer exists.
For alert data, alerts are no longer displayed in the application once their associated data has been deleted.
For analysis data, the graph will display a blank area for data that no longer exists.
Reducing data retention
If you decide to reduce the amount of data being retained, for example reducing Basic machine data from 2 months to 2 weeks, then the purge process will require time to process the data. Therefore say that there is 5GB of Basic machine data, and a change should reduce that to 3GB, the process needs to identify and delete 2GB of data.
This documentation contains proprietary information and is protected by copyright law.
Copyright © 2026 Red Gate Software Limited. All rights reserved


