Profiling SQL queries
Published 11 June 2013
SQL call profiling is only available in ANTS Performance Profiler Professional edition.
When you profile an application, you can profile any calls it makes to any Microsoft SQL Server or Oracle database instance, including those running in Amazon RDS and Microsoft Azure. Database call profiling works with calls to both local and remote databases, and for any version of SQL Server. This helps you build up a better picture of how your application accesses data.
For example, a slow-running web application could have a performance bottleneck around data access. SQL profiling would help you narrow the cause down to something like poorly-optimized SQL statements, or the network round-trip.
Timing data for SQL calls is captured in all profiling modes except for Sample method-level timings mode.
Viewing SQL profiling results
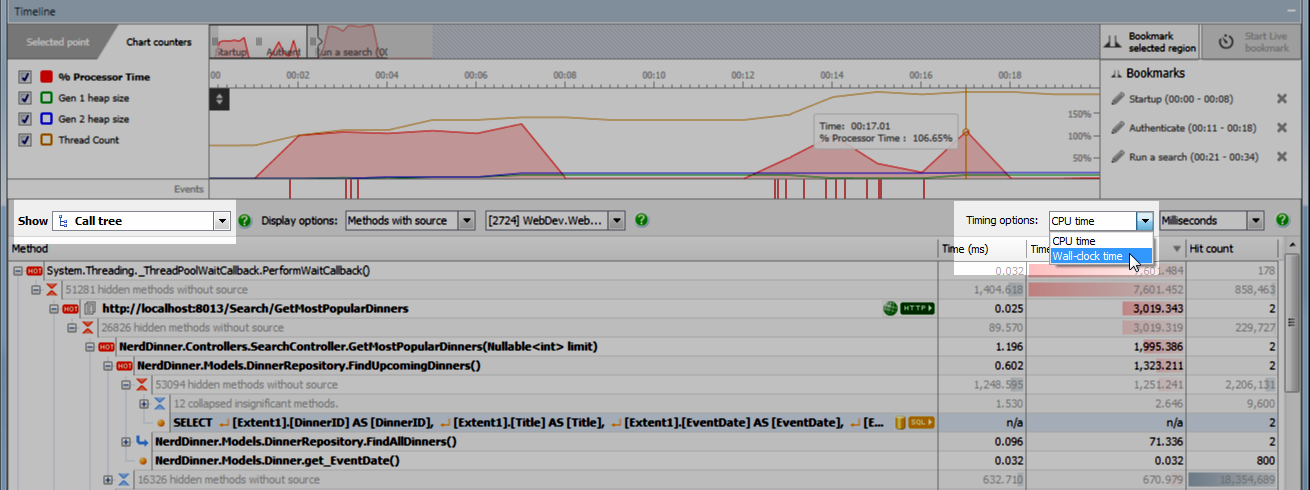
Database calls appear in the call tree as children of the .NET methods that generate them.
- On the results toolbar, from the profiling results view dropdown menu, select Call tree view. From the Timing options dropdown menu, select Wall-clock time:
- Select the part of the timeline that you're interested in; see Working with the timeline.
The call tree now only shows profiling results from the time period you selected. - In the call tree, database calls have the
 icon next to them.
The call tree shows the first line of the database query (excluding any initial blank lines), the time the query took to return its first result, and the query's hit count. To see the full text of the query, click the
icon to switch to Database Calls view.
The Database Calls view shows you all the queries your application made during the selected time period.
For more information, see Working with Database Calls view.
Troubleshooting
This documentation contains proprietary information and is protected by copyright law.
Copyright © 2026 Red Gate Software Limited. All rights reserved


