Connecting to Grafana
Published 03 September 2026
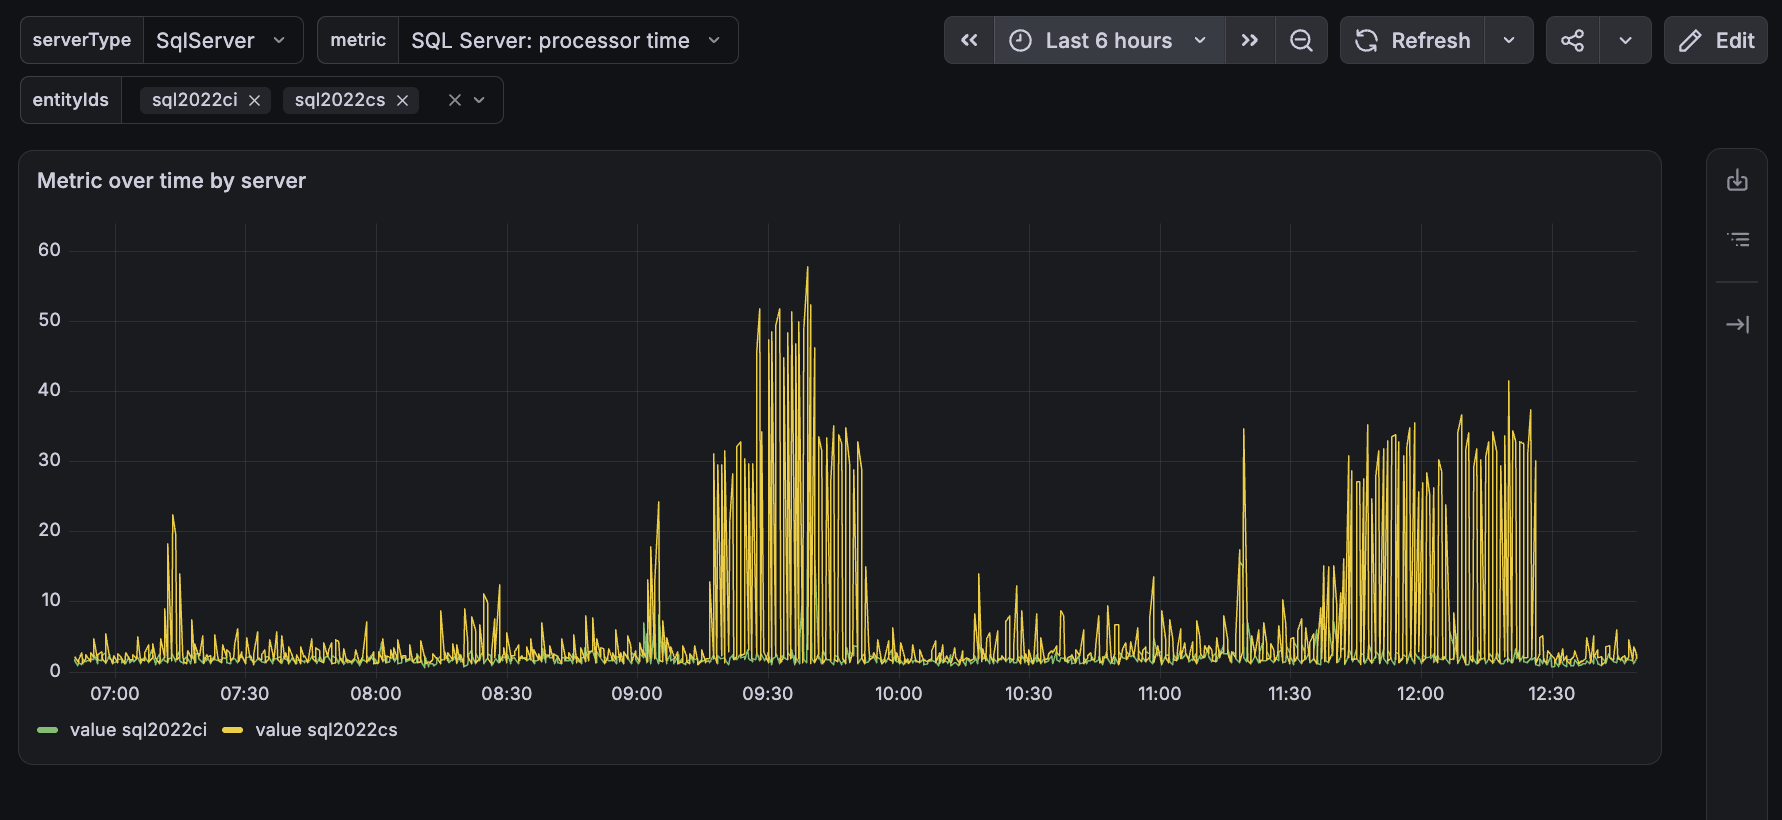
What this page covers: connecting Grafana to the Redgate Monitor v2 API with the Infinity datasource plugin, and building an interactive dashboard with three linked dropdowns (server type, metric, server instance) driving a live time series chart.
What you need:
- Docker, if you don't already have a Grafana instance to use (see Step 1)
- A Redgate Monitor instance with the v2 API enabled (self-hosted with an Enterprise licence)
- A read-only API token from that instance. See Authentication.
- Network access to your Redgate Monitor URL
Step 1 - start Grafana with the Infinity plugin
Already have a Grafana instance? You don't need Docker. Jjust install the Infinity datasource plugin on your existing instance instead, then skip ahead to Step 2 below. The standard way is grafana-cli plugins install yesoreyeram-infinity-datasource, followed by a Grafana restart, or through the Plugins page in Grafana's admin UI if plugin installs are enabled there. The rest of this step uses Docker only to spin up a disposable Grafana instance for anyone who doesn't have one to hand.
Run this command to start Grafana with the Infinity datasource pre-installed:
docker run -d \
  --name grafana-poc \
  -p 3000:3000 \
  -e "GF_INSTALL_PLUGINS=yesoreyeram-infinity-datasource" \
  grafana/grafana:latest
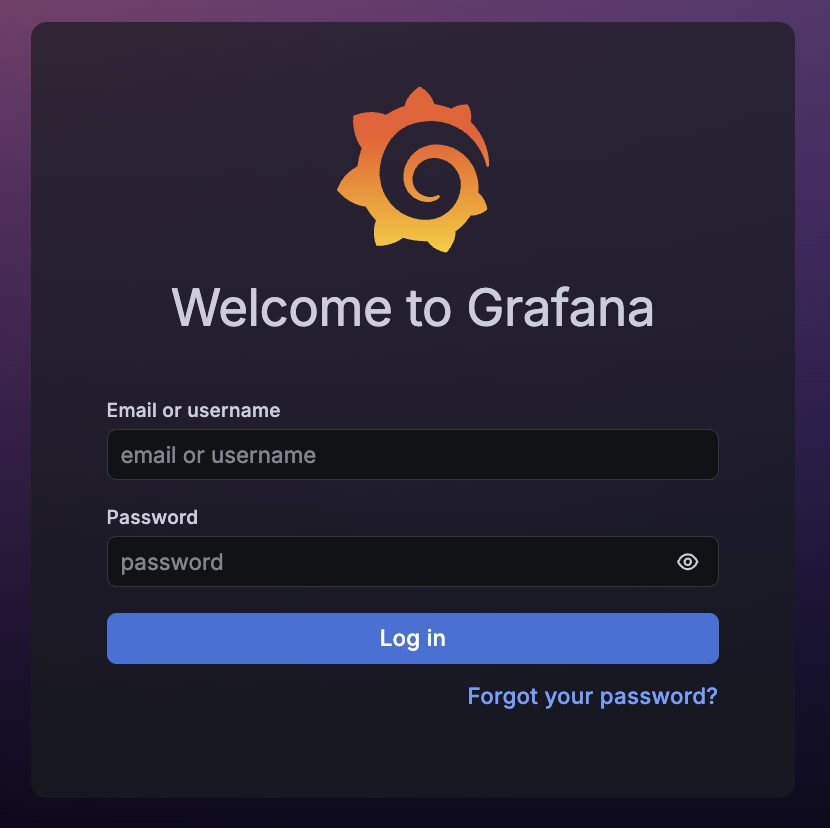
Wait for the container to start, then open http://localhost:3000 in your browser. Log in with username 
admin and password admin. Grafana will prompt you to change the password. You can skip this for a local proof of concept.
Step 2 - add the Infinity datasource
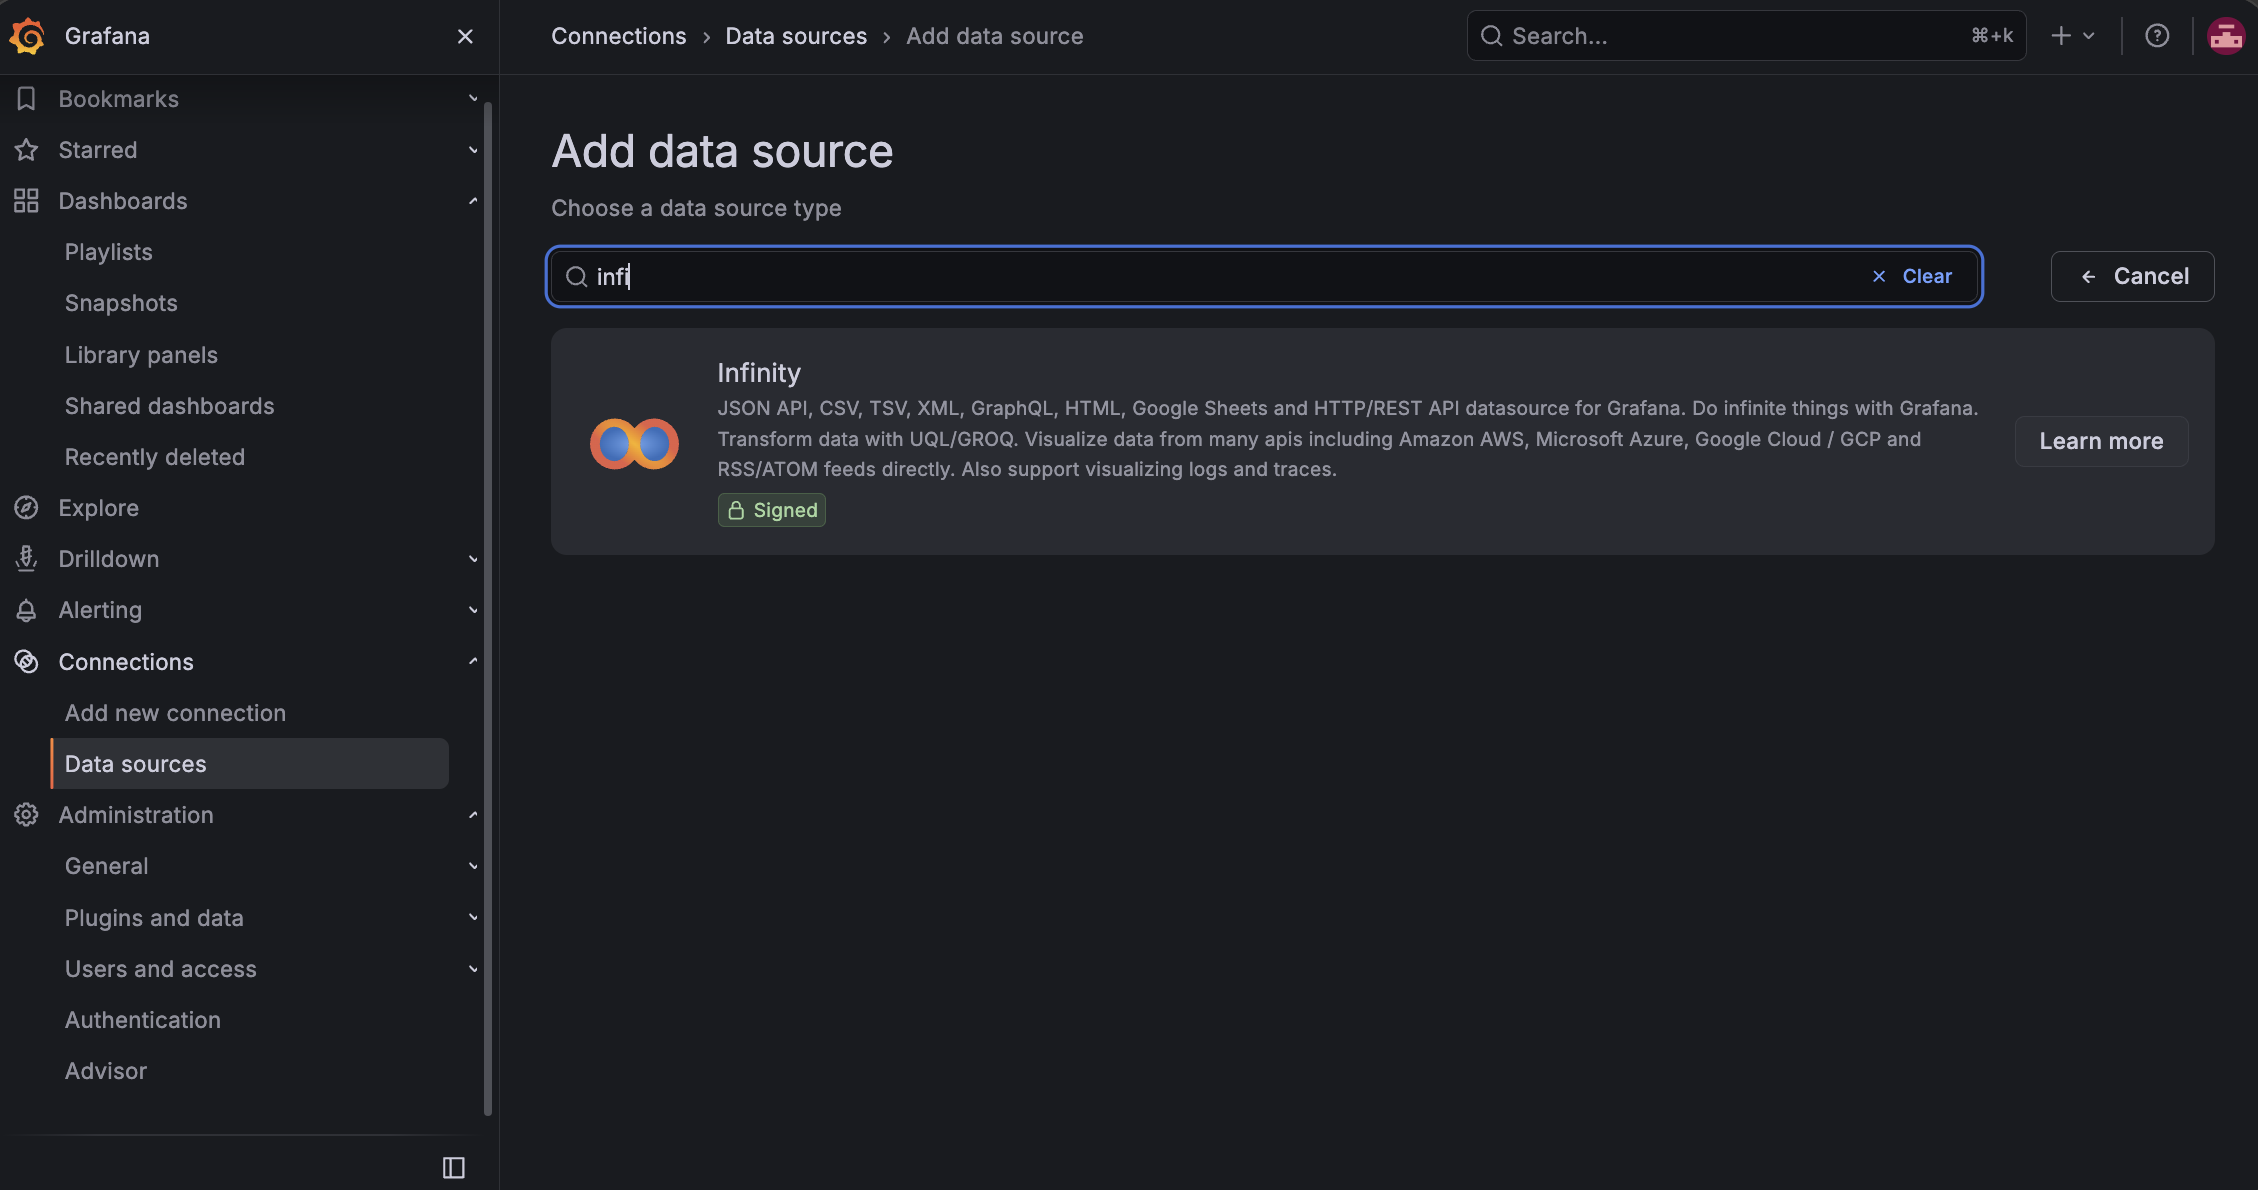
- In the left sidebar, click Connections then Data sources.
- Click Add new data source.
- Search for Infinity and select it.
Give the datasource a name (e.g. Redgate Monitor).
Configure authentication
In the Settings tab
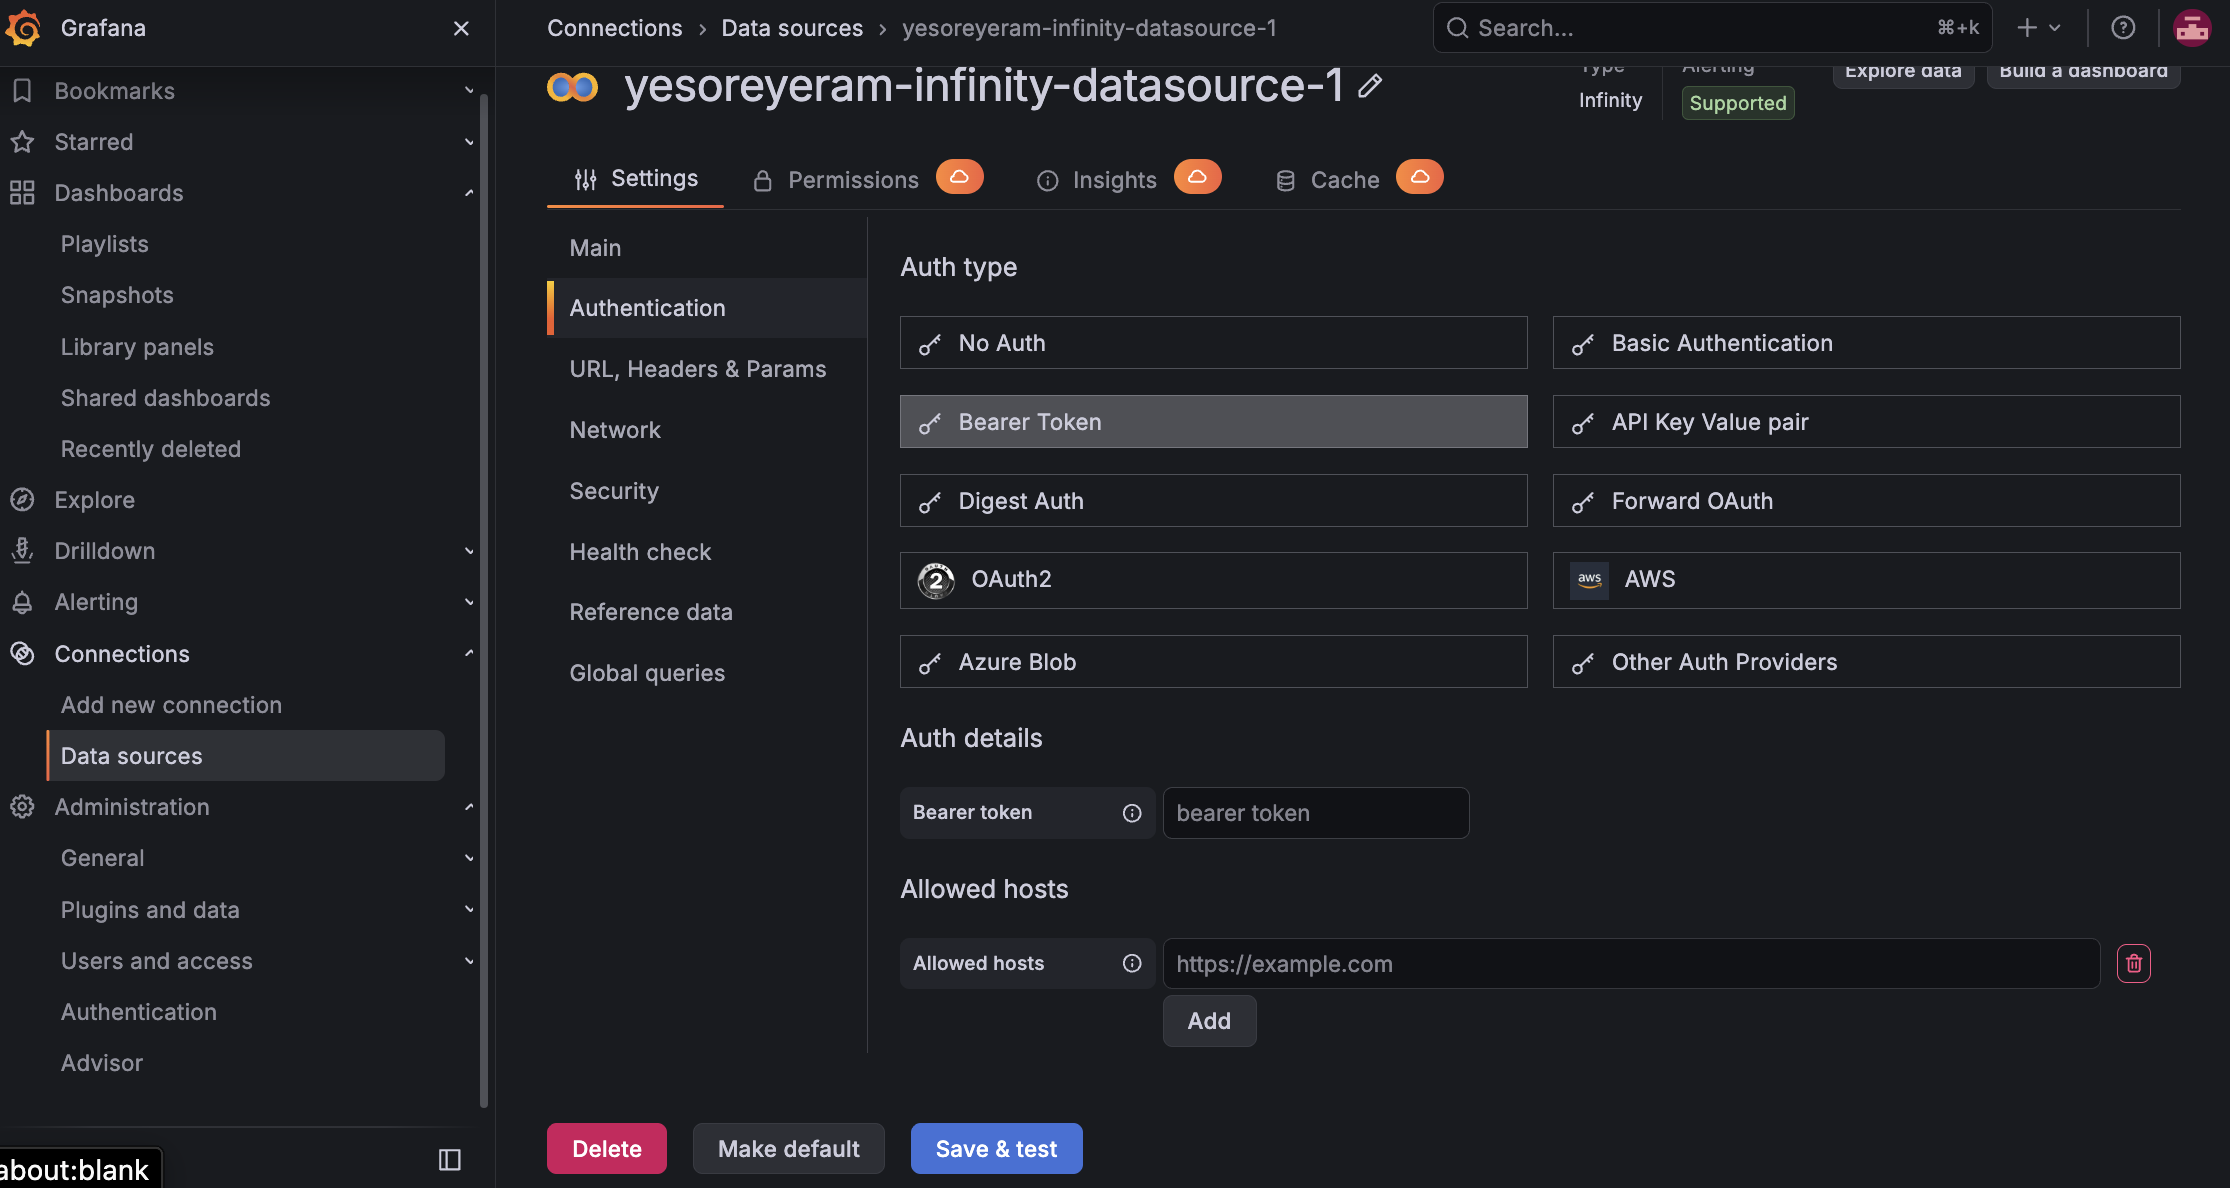
- Click Authentication
- Set the Auth type to Bearer Token.
- Set the Bearer token field value in Auth details to
<your-token>, where<your-token>is the base64 token blob from Redgate Monitor (Configuration, then API tokens, then copy the token value shown after creation). - Set the Allowed hosts field value in Allowed hosts to your Redgate Monitor base URL (e.g.
https://your-monitor-instance.example.com). - Click Save & test. You will see a green "Datasource is working" confirmation.
Step 3 - smoke test (optional but recommended)
Before building the dashboard, confirm the API is reachable and returning data. Run this in a terminal, replacing the values with your own:
export MONITOR_URL="https://your-monitor-instance.example.com"
export MONITOR_TOKEN="your-token-blob"

curl -s \
  -H "Authorization: Bearer $MONITOR_TOKEN" \
  "$MONITOR_URL/api/v2/monitored-servers"
You will see a JSON response starting with {"status":"success","data":...}. If you see an error, check that:
- The token is correct and has not expired.
- Your network can reach the Monitor URL (a VPN may be required for internal instances).
- The v2 API is enabled on your Monitor instance (requires an Enterprise licence).
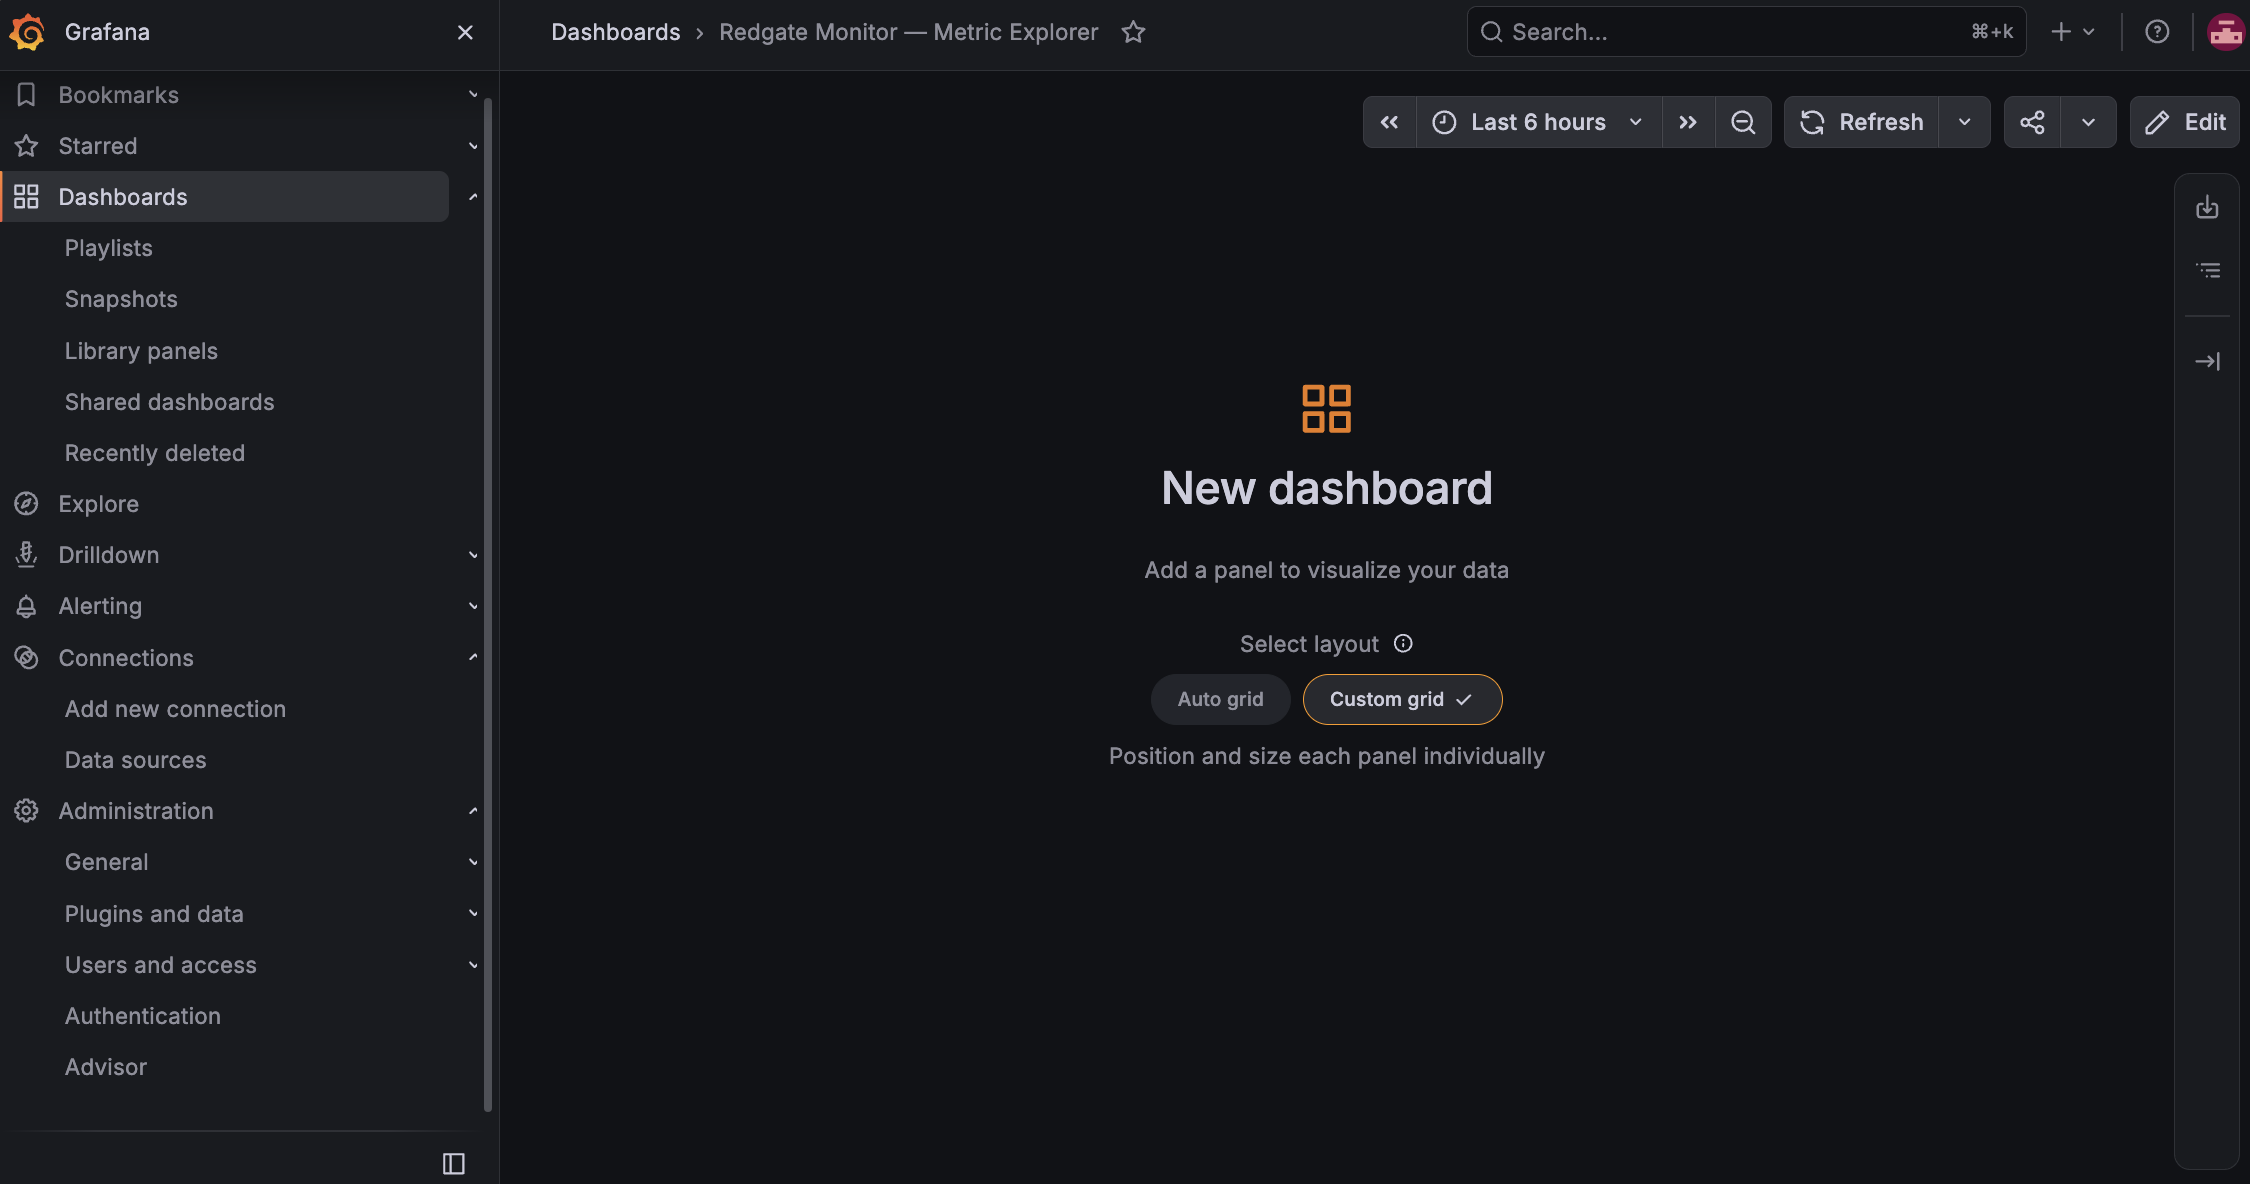
Step 4 - create a new dashboard
- In the left sidebar, click Dashboards, then New, then New dashboard.
- Click Save dashboard (top right), give it a name such as
Redgate Monitor - Metric Explorer, and save.
Step 5 - create the template variables
Variables are the dropdowns that filter the dashboard. You will create three: serverType, metric, and entityIds. They must be created in this order, because each one depends on the selection above it.
Open Dashboard settings (gear icon, top right), then Variables, then New variable.
Variable 1 - serverType
This dropdown lists the server platforms currently being monitored (e.g. SqlServer, PostgreSQL). It's sourced dynamically from the monitored-servers endpoint, so it automatically includes new platforms as Redgate Monitor adds support for them.
Field | Value |
|---|---|
Name |
|
Label (optional) |
|
Type | Query |
Data source | Redgate Monitor (your Infinity datasource) |
Query type | JSON |
Source | URL |
URL | |
Parser | JSONata |
Multi-value | OFF |
Include All option | OFF |
Rows/Root:
$distinct(data.{ "__text": entityType, "__value": entityType })
Click Run query to preview the values, then Apply.
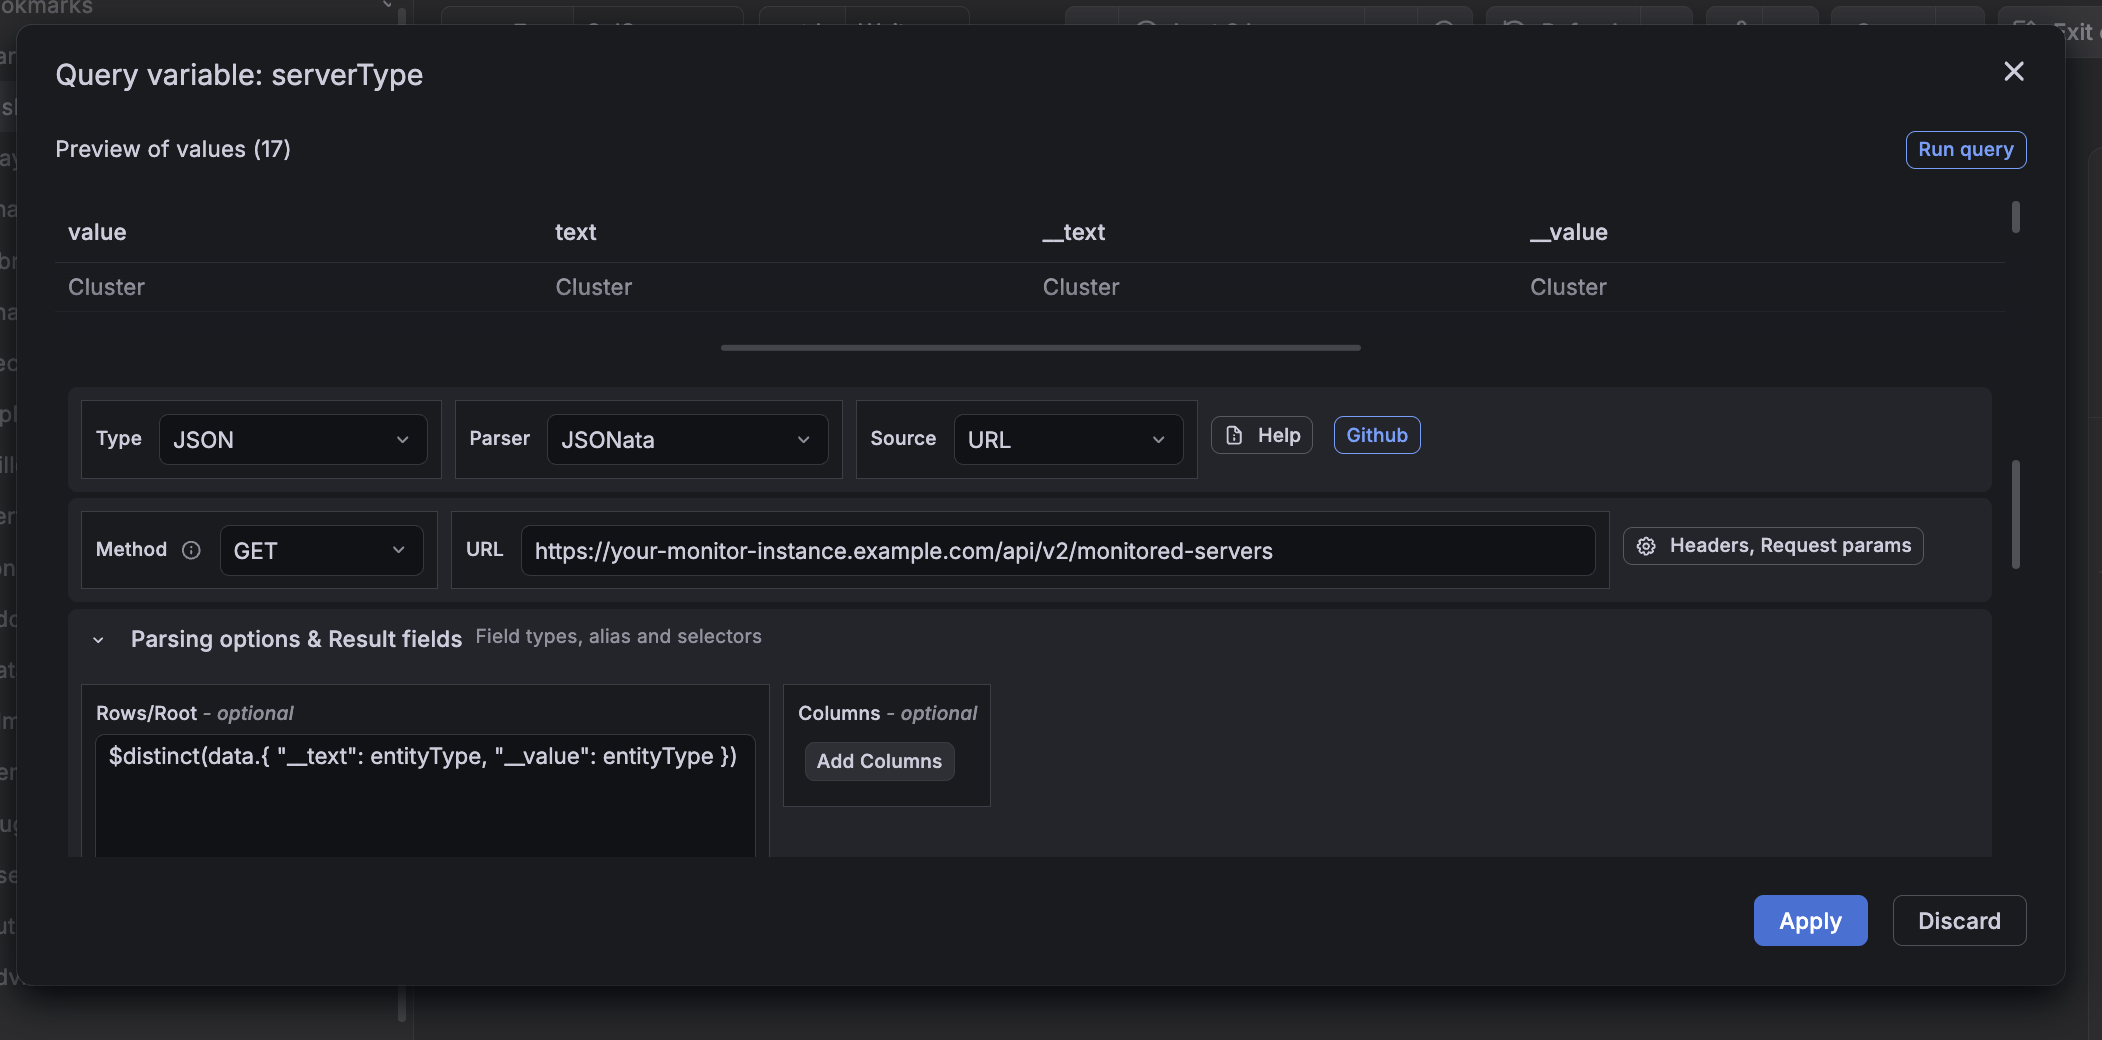
Note on the Rows/Root field: in Infinity v4, the "Parsing options" section may be collapsed by default. Click it to expand. The Rows/Root field must be visible and populated for the variable to work.
Variable 2 - metric
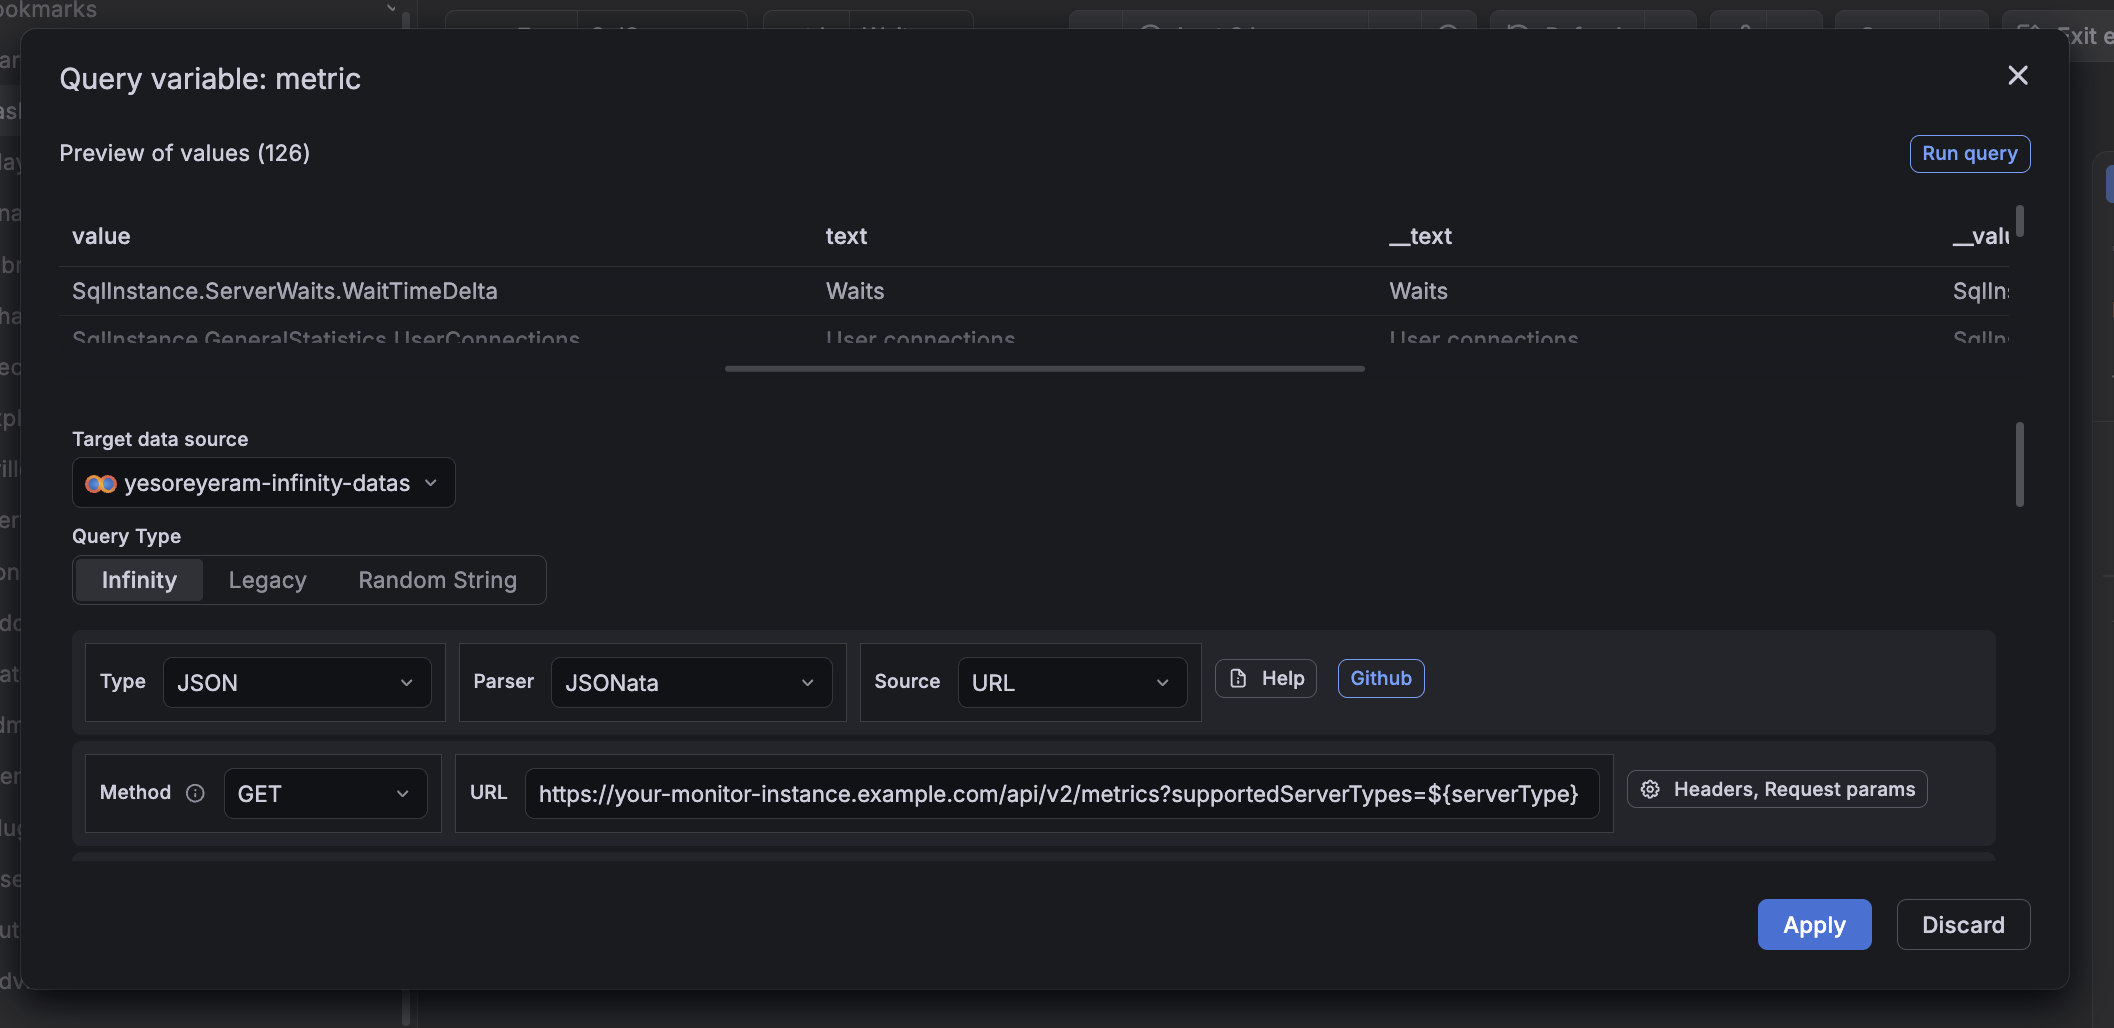
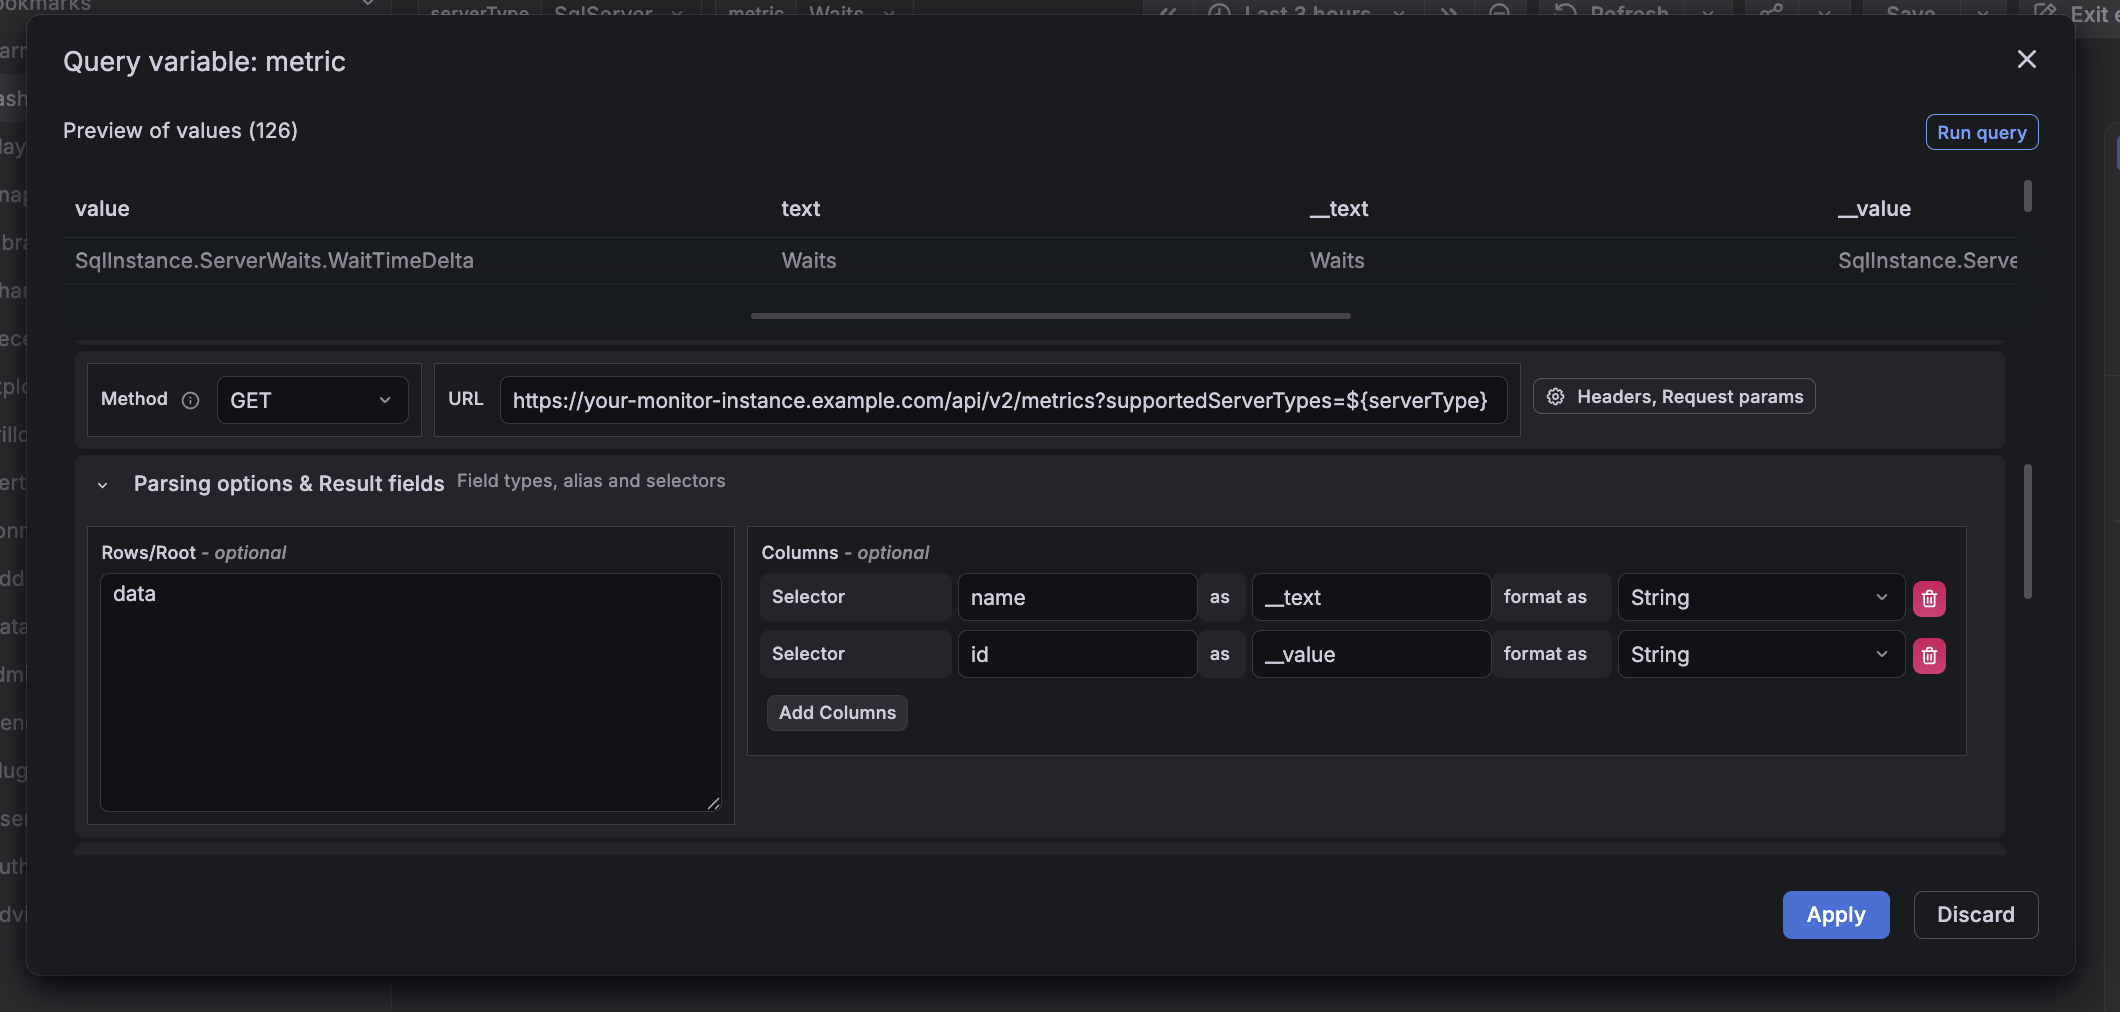
This dropdown lists metrics supported by the selected server type.
Field | Value |
|---|---|
Name |
|
Label (optional) |
|
Type | Query |
Data source | Redgate Monitor |
Query type | JSON |
Source | URL |
URL | |
Parser | JSONata |
Multi-value | OFF |
Include All option | OFF |
Rows/Root:
data.{ "__text": name, "__value": id }
Click Run query to preview, then Apply.
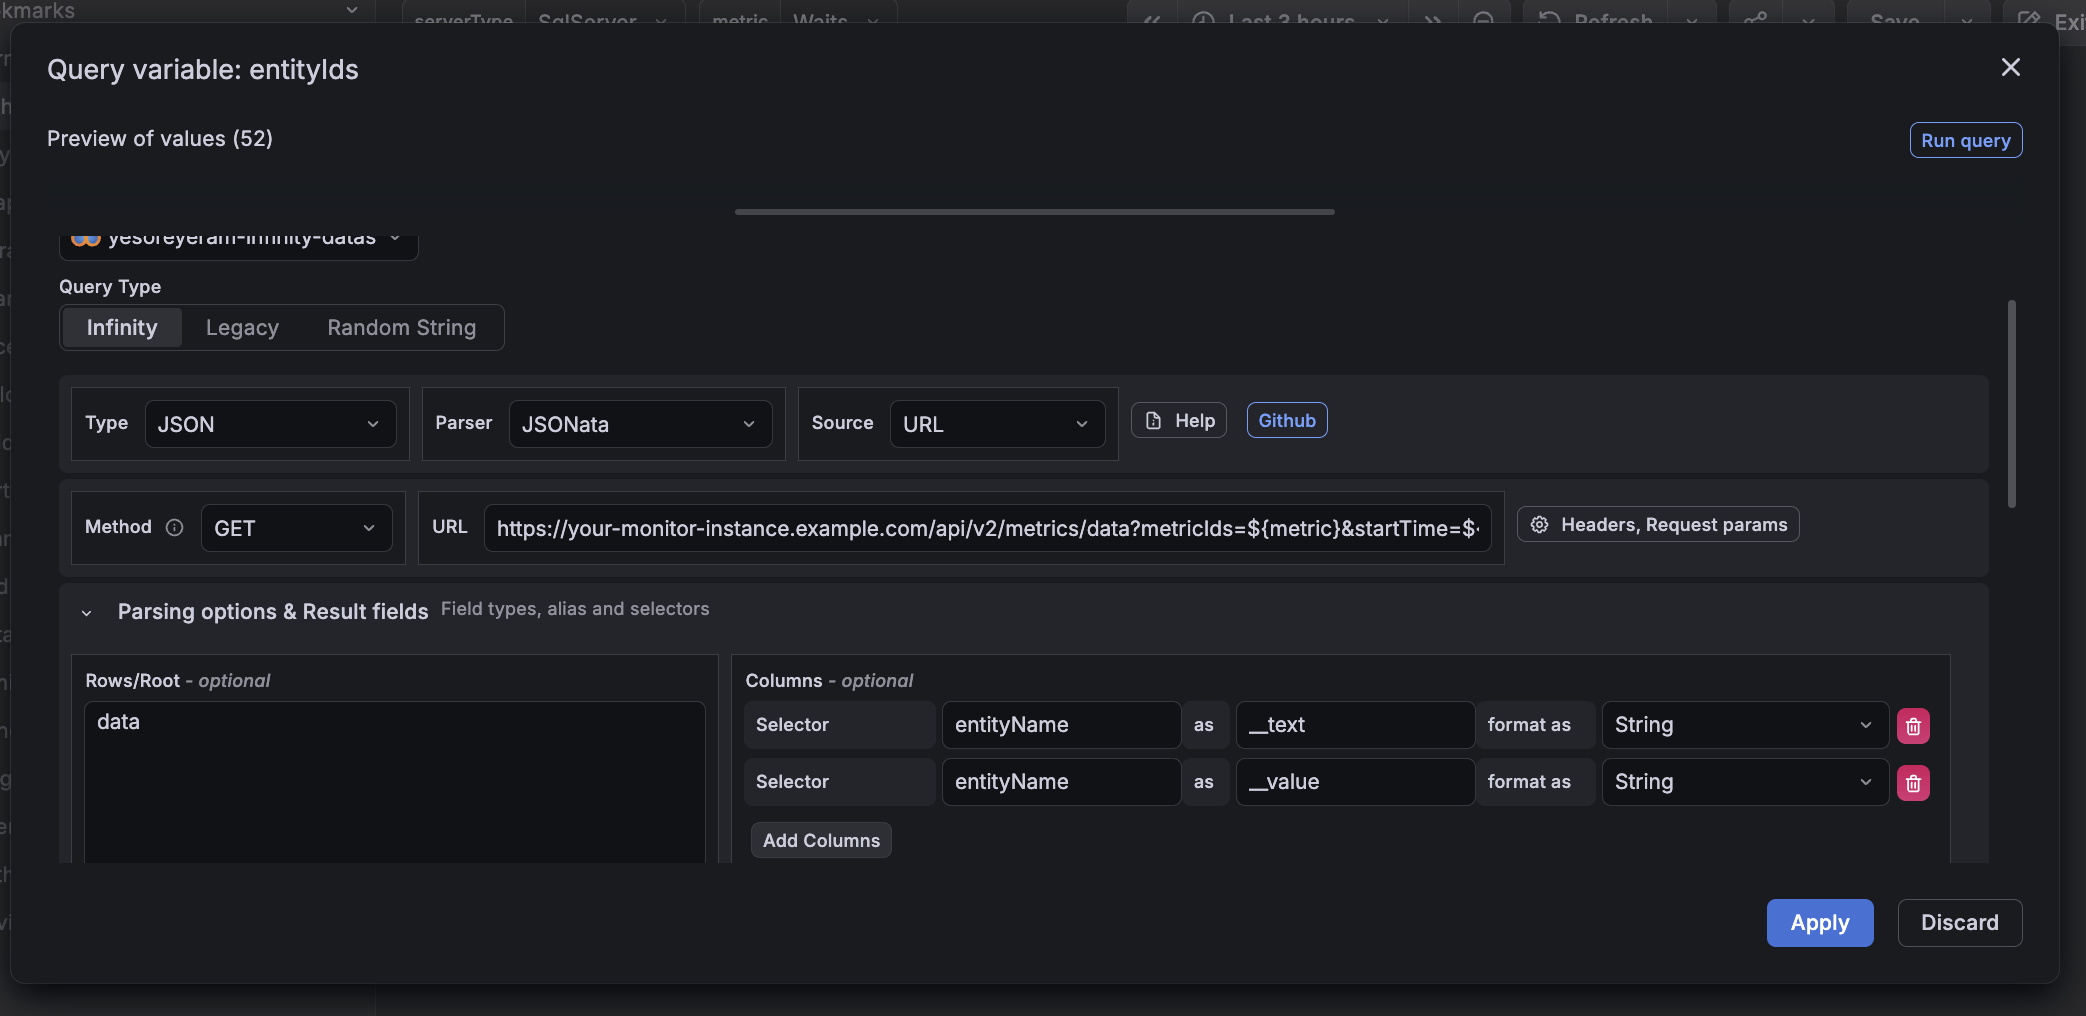
Variable 3 - entityIds
This dropdown lists the server instances that have data for the selected metric in the current time window. Sourcing it from the metrics endpoint (rather than monitored-servers) ensures the instance names in the dropdown exactly match what the chart uses for filtering.
Field | Value |
|---|---|
Name |
|
Label (optional) |
|
Type | Query |
Data source | Redgate Monitor |
Query type | JSON |
Source | URL |
URL | |
Parser | JSONata |
Multi-value | ON |
Include All option | ON |
Rows/Root:
data.{ "__text": entityName, "__value": entityName }
Click Run query to preview, then Apply.
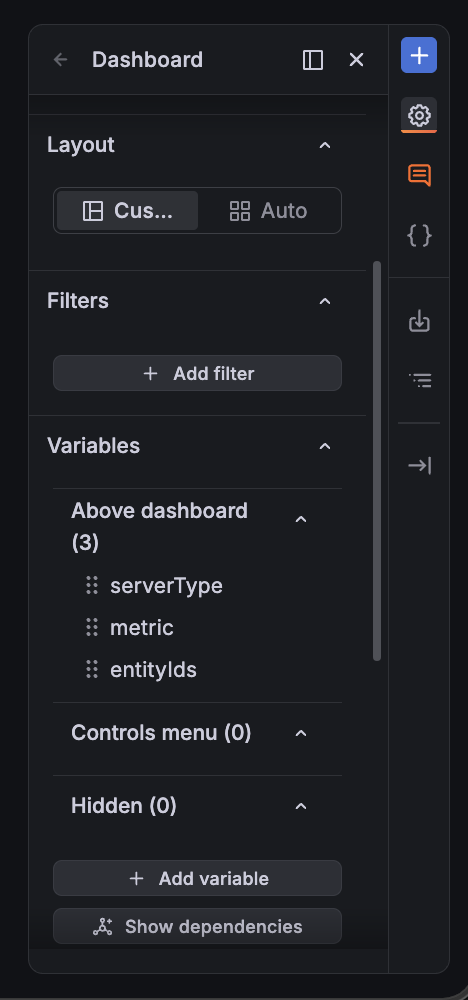
Check variable order
Back in the Variables list, confirm the order top-to-bottom is serverType, then metric, then entityIds. Drag to reorder if needed. Grafana resolves variables in list order, so each must come after the one it depends on.
Close Dashboard settings.
Step 6 - add the time series panel
- On the dashboard, click Add, then Visualization.
- In the visualization picker (top right of the panel editor), select Time series.
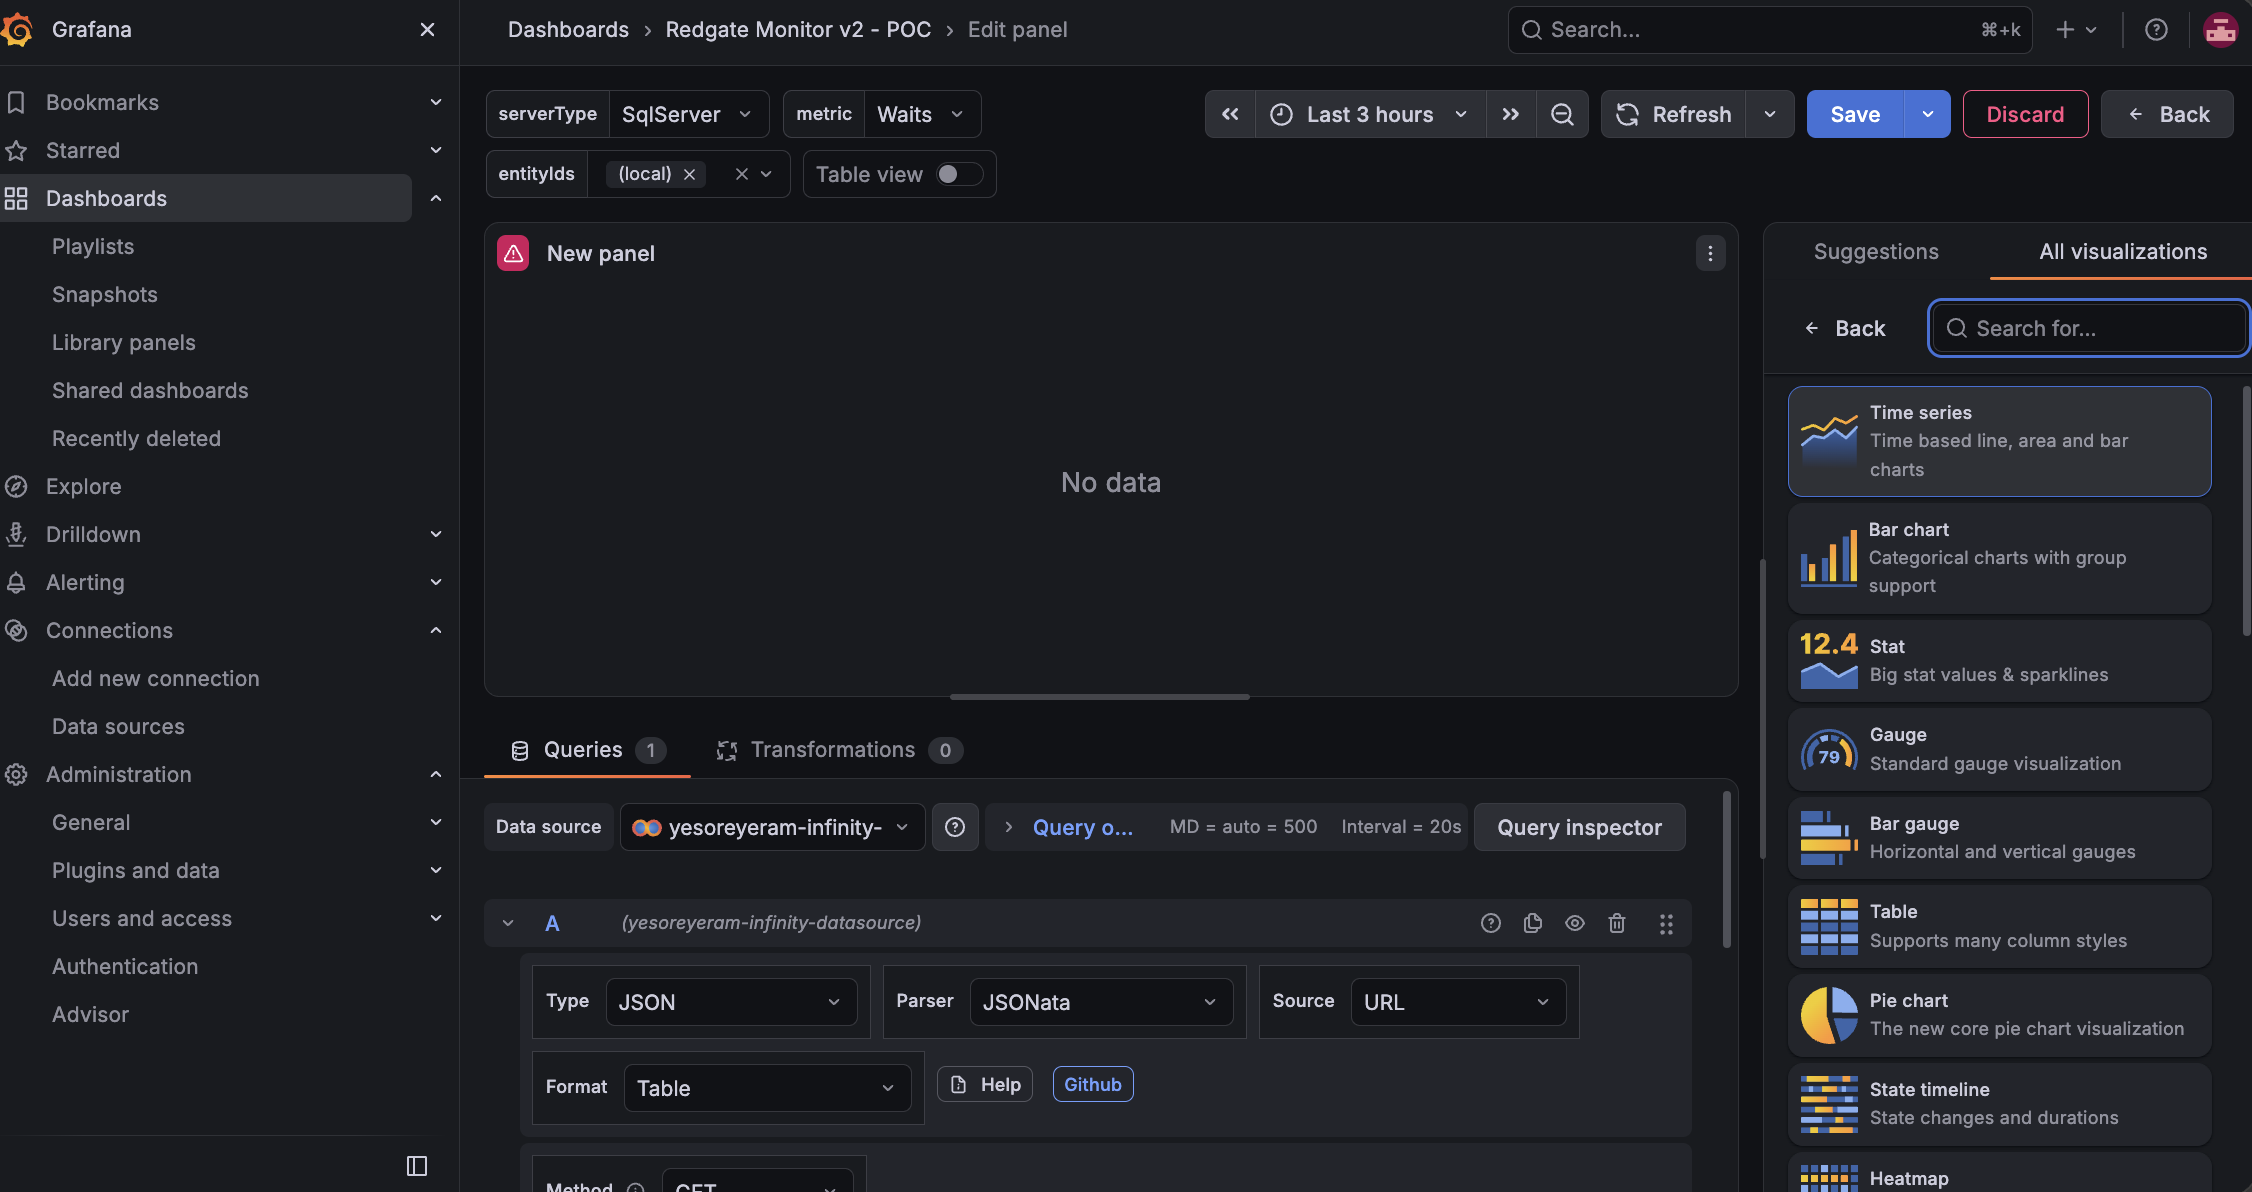
Configure the Infinity query
In the query editor at the bottom of the panel editor:
- Select your Infinity datasource.
- Set Type to
JSON. - Set Source to
URL. - Set Format to
Time series. - Set Method to
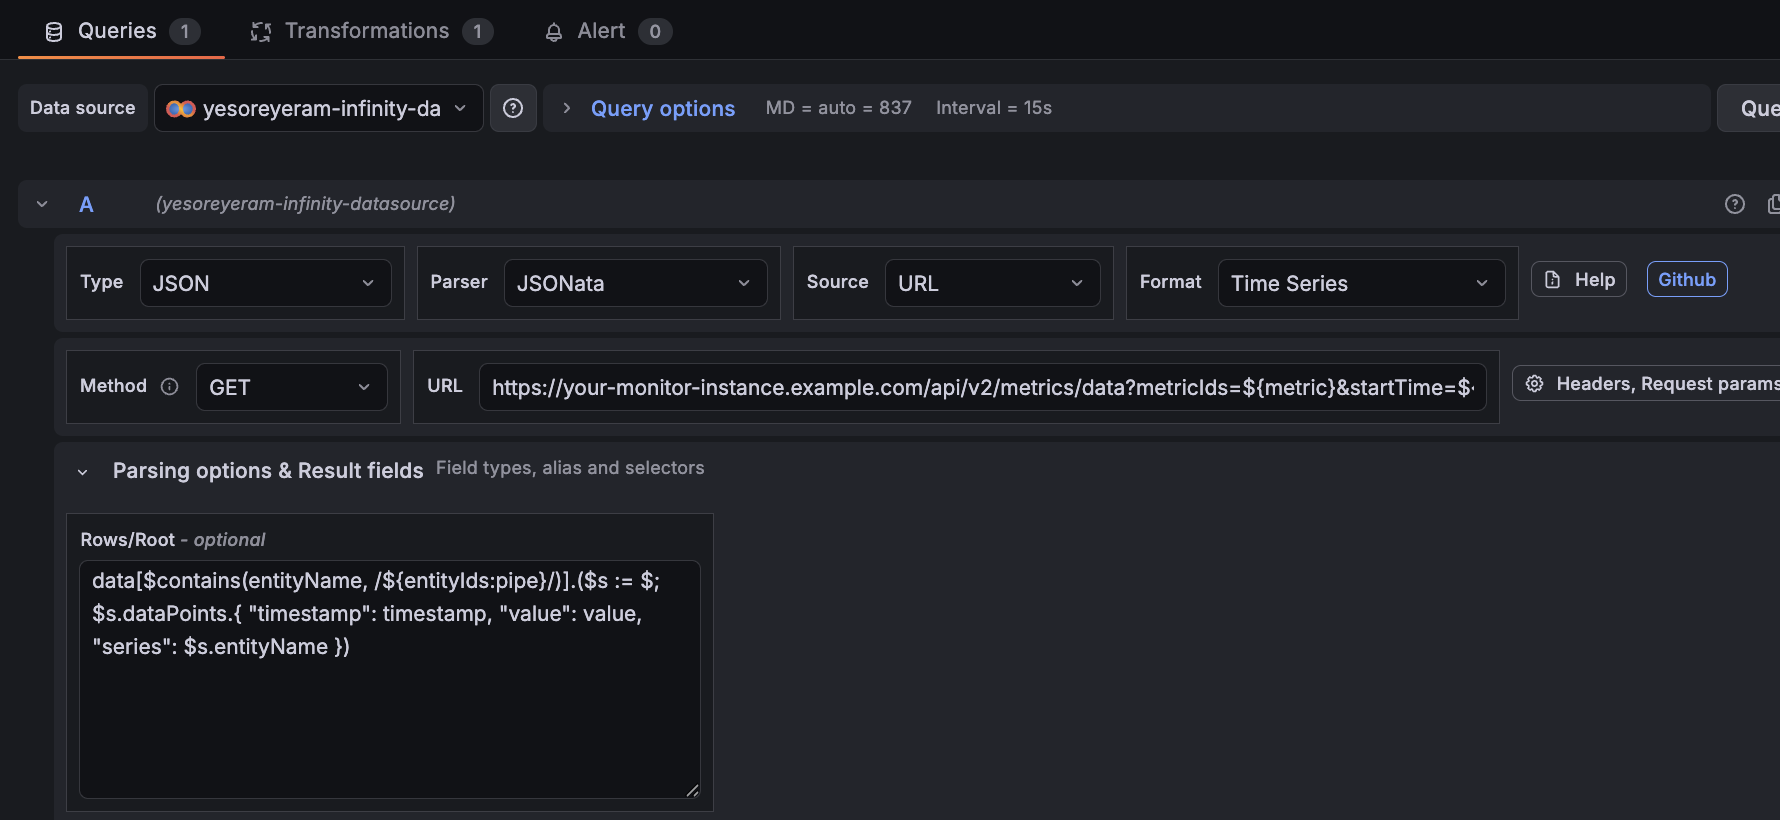
GET. - Set the URL to:
https://your-monitor-instance.example.com/api/v2/metrics/data?metricIds=${metric}&startTime=${__from:date:iso}&endTime=${__to:date:iso}This fetches data for the selected metric across all server instances. Entity filtering is done in the JSONata expression rather than as a URL parameter (explained below). - Set Parser to
JSONata. - Expand the Parsing options section and set Rows/Root to:
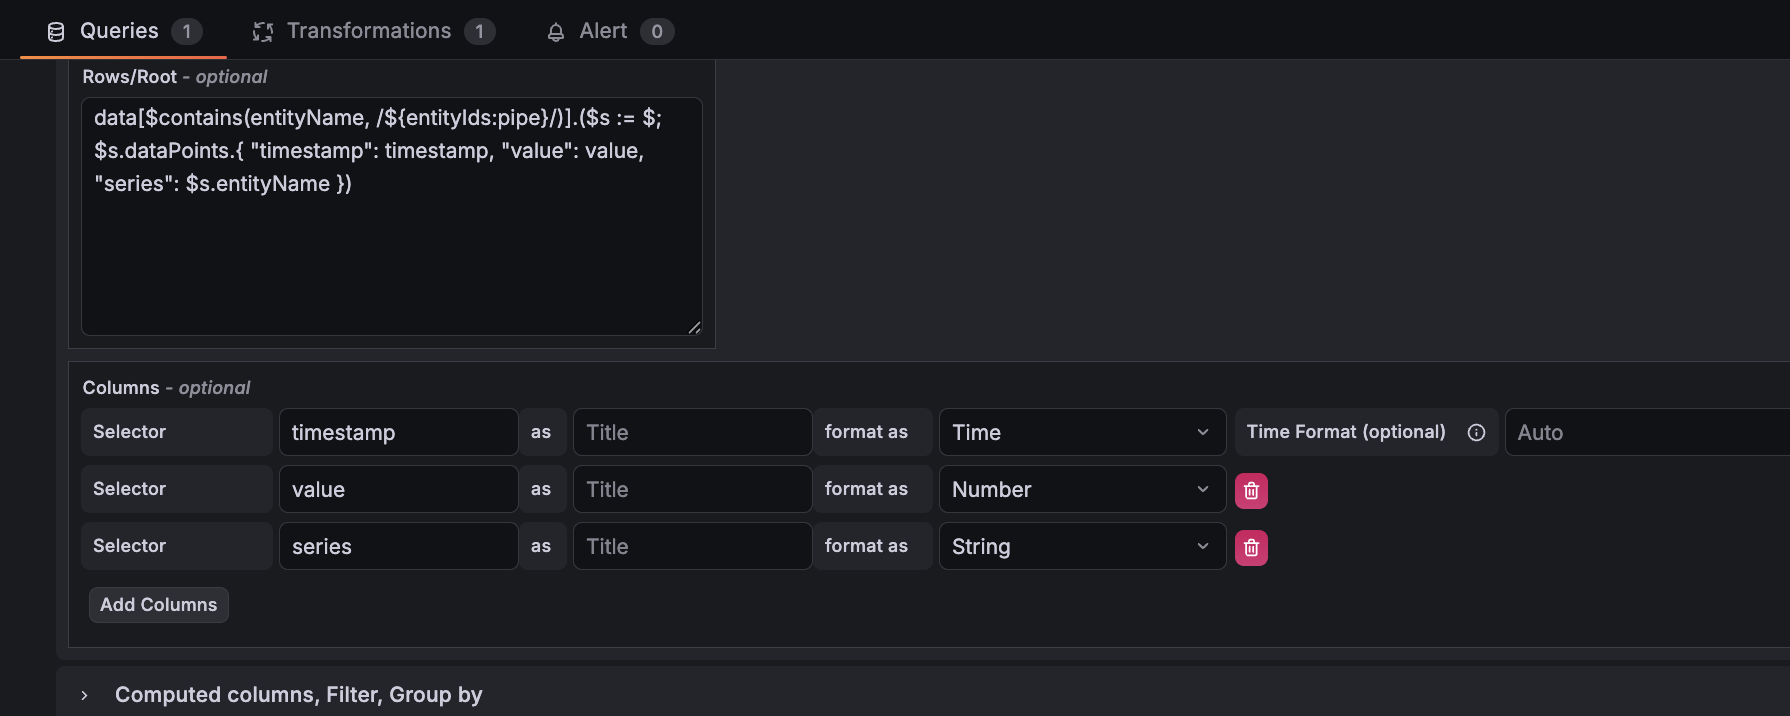
data[$contains(entityName, /${entityIds:pipe}/)].($s := $; $s.dataPoints.{ "timestamp": timestamp, "value": value, "series": $s.entityName })This expression does three things:
- Filters the response to only the entity names selected in the
entityIdsdropdown ($containswith a pipe-separated regex handles multi-select). - Flattens the nested
dataPointsarray into one row per data point. - Adds a
serieslabel so each server instance becomes a separate line.
Define the result columns
Still in Parsing options, add three columns in the Columns section:
Selector | Type | Title (leave blank) |
|---|---|---|
| Time | |
| Number | |
| String |
ISO 8601 timestamps aren't automatically recognised as time values in Infinity. The Time type must be set explicitly, or the panel shows "Data is missing a time field". Defining columns also controls which fields are included in the output, so all three must be listed.
Add the Partition by values transformation
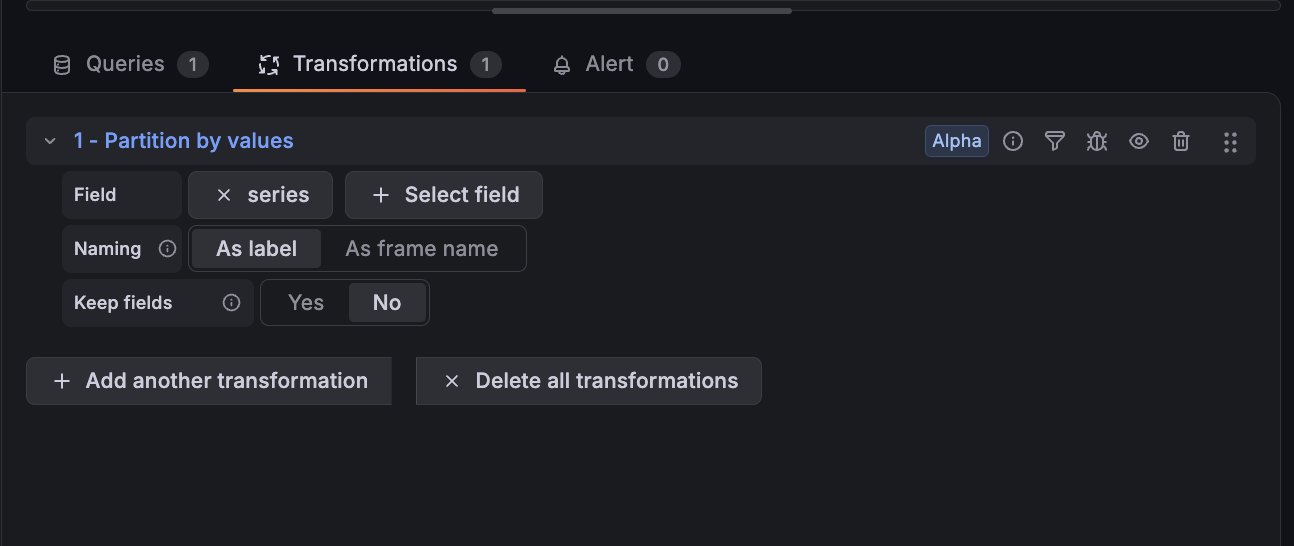
The query returns a single long table of (timestamp, value, series) rows. Without splitting it, Grafana draws one merged line. The Partition by values transformation separates it into one line per server instance.
- Click the Transform data tab (next to Query, at the bottom of the panel editor).
- Click Add transformation, then Partition by values.
- Set the Field to
series.
Name and save the panel
- Set the panel title to
Metric over time by server(top left of the panel editor). - Set the dashboard time range to at least 15 minutes (e.g. Last 1 hour). The v2 API returns an error for time ranges shorter than 15 minutes.
- Click Apply (top right) to return to the dashboard, then Save dashboard.
How it works together
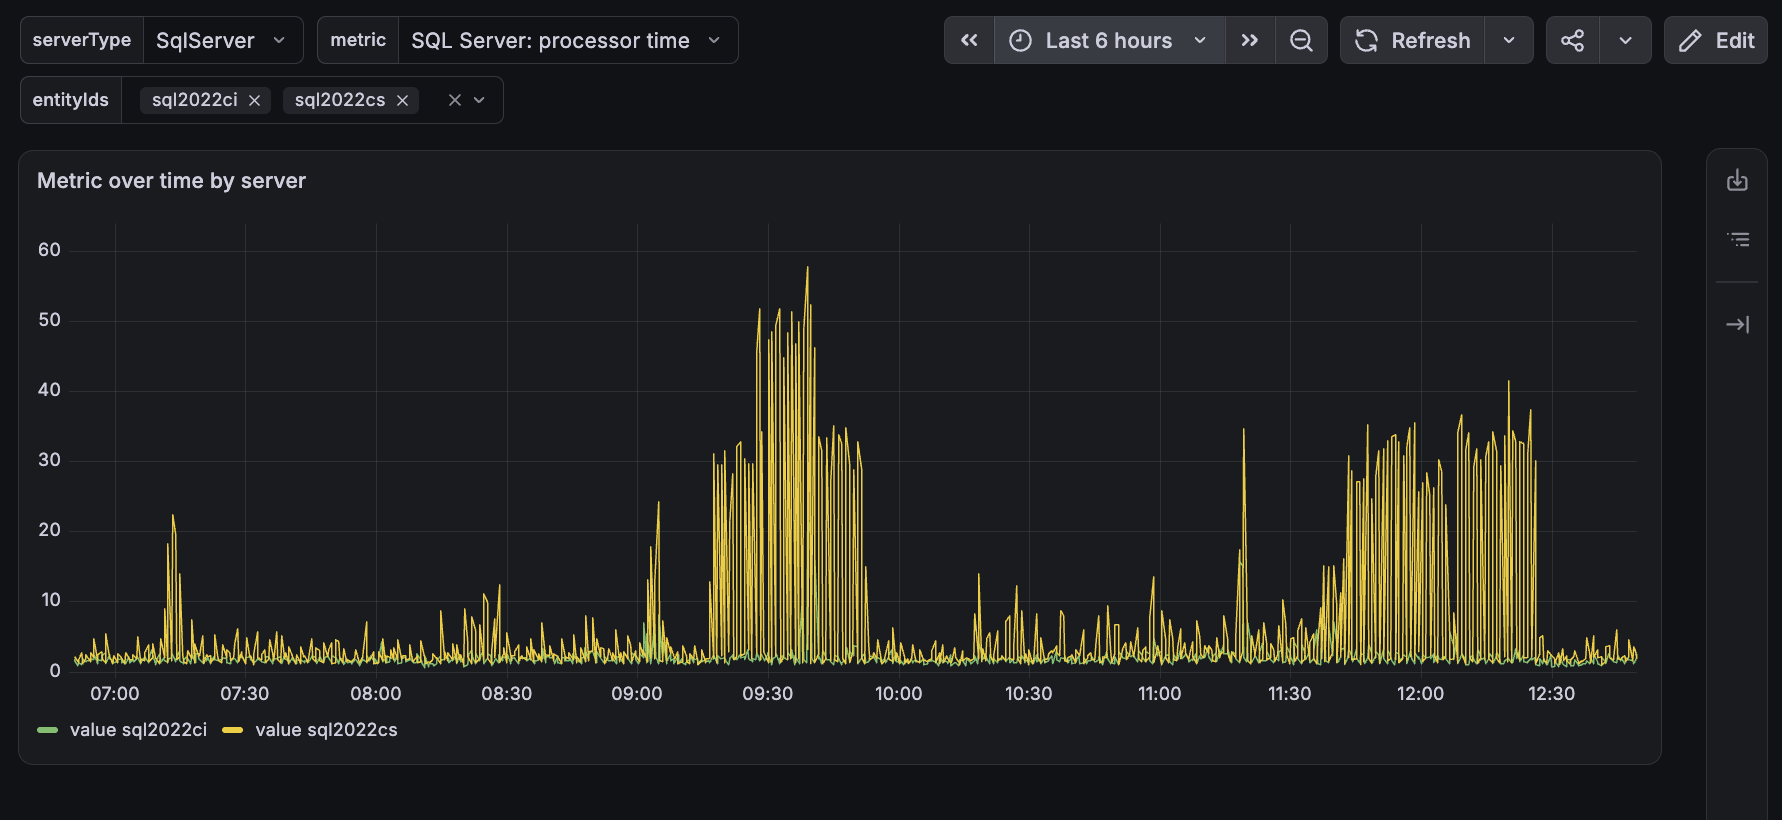
Selecting a server type refreshes the metric dropdown to show only metrics for that platform. Selecting a metric refreshes the server instances dropdown to show only instances that have reported data for that metric in the current time window. Selecting one or more instances filters the chart lines. Changing the Grafana time range picker updates both the entity list and the chart data automatically.
Want to see other examples?
If you're connecting a different tool to the v2 API, or want to see another worked example like this one, get in touch.
This documentation contains proprietary information and is protected by copyright law.
Copyright © 2026 Red Gate Software Limited. All rights reserved


