Is tempdb usage causing performance problems?
Published 28 March 2024
How to investigate tempdb as a potential source of performance problems, using Redgate Monitor.
Basic Diagnosis of tempdb issues
If you suspect that tempdb is causing a bottleneck the first step is to understand how is tempdb being used and by whom.
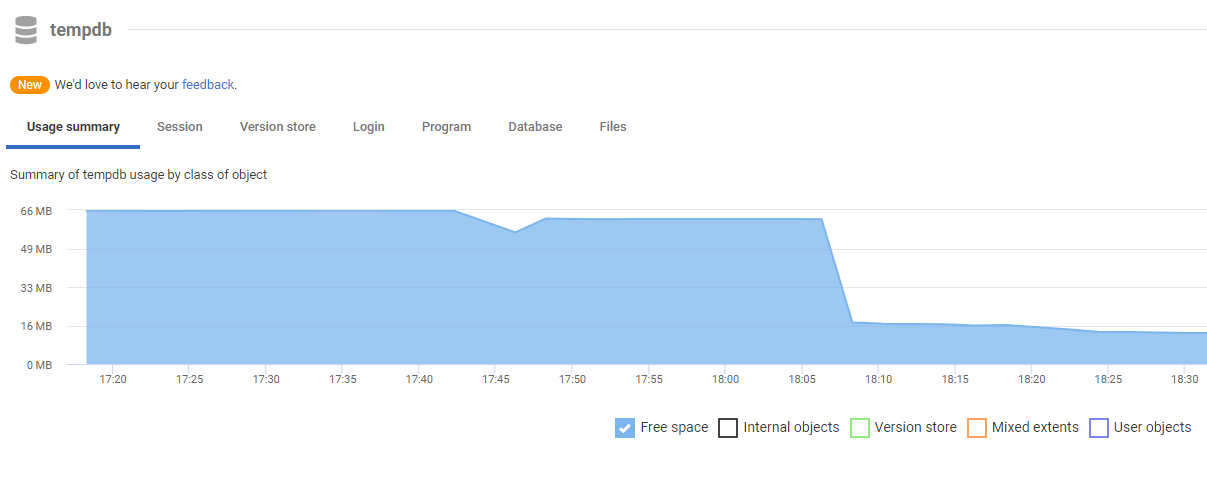
The tempdb section on the Server Overview page tracks much of the information recommended in Microsoft's whitepaper on Troubleshooting Insufficient Disk Space in tempdb and is the best place to start your investigation. The main tempdb usage summary graph shows how space is used in tempdb over time and this will allow you to perform the following checks:
Track used and free space in tempdb
On some instances, tempdb requires a lot of space, pre-allocated so files aren’t constantly growing. If tempdb uses all the space allocated to it and can't grow it will halt any further activity in SQL Server that needs tempdb. Learn about tracking space on volumes hosting tempdb data and log files in Tracking Disk Space Usage and Database Growth.
If free tempdb space is being depleted rapidly over a period, the tempdb usage summary graph will help you track down the cause, using the session, login, database and application tabs (see Who and what is using tempdb space and why?)
You can use the same technique to understand why tempdb has grown. If this is a recurring problem, you may consider setting up an Extended Events-based custom metric track catch the queries causing this tempdb growth, as they happen.
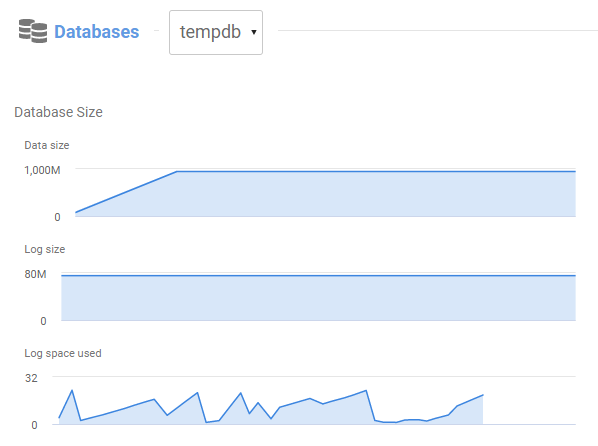
You can also check the Databases section of the Server Overview page. Filter for tempdb and review storage metrics, both for tempdb database and for individual data files and the log. This section also provides sparklines for performance metrics such as transactions and log flushes.
What types of object are being created in tempdb?
The tempdb database is available to all users of a SQL Server instance to house the following different types of objects.
- User objects: temporary user-created objects such as temporary tables, table variables, or tables returned in cursors and TVFs.
- Internal objects: SQL Server creates various worktables and workfiles in tempdb to store intermediate results for some types of joins, aggregations, sorts, spooling operations, cursors, and table value functions. Sometimes these operations can spill to tempdb on disk. SQL Server can also use tempdb space for index maintenance operations, such as rebuilds.
- Version store: if a SQL Server database is enabled for
ALLOW_SNAPSHOT_ISOLATIONorREAD_COMMITTED_SNAPSHOT, allUPDATEandDELETEcommands will generate versions of the previously committed rows and store them in tempdb version store. - Mixed Extents: Mixed extents are primarily seen in SQL Server 2014 and earlier. While mixed extents are not directly a problem, heavy use of mixed extents by many temporary objects can lead to tempdb page allocation contention.
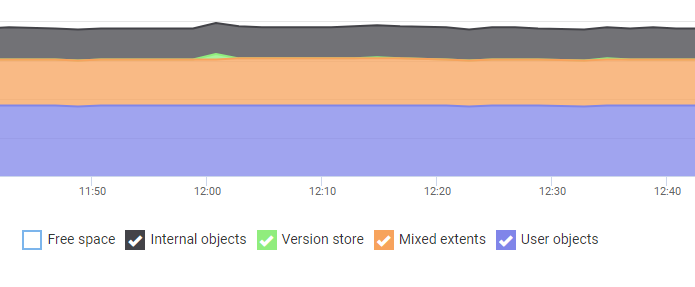
You can track the space used by each object type using the check boxes under the tempdb usage summary graph:
Who and what is using tempdb space and why?
Subsequent tabs on the tempdb usage summary graph break down this data as follows:
- Session graph and table can identify sessions and individual queries that are creating temporary objects, such as temp tables or variables (user allocations/deallocations) or spilling to tempdb for various reasons (internal allocations/deallocations). This can also help track down big allocations that are not subsequently de-allocated properly.
- Login, application and database reveal who or what is issuing queries that are using tempdb resources and the database where the query originated.
- Version store tracks use of version store by database and reports IO metrics (amount generated by snapshot-based updates or deletes) and any long running snapshot-based transactions.
The session tab of the graph will reveal the SQL Text of queries using space in tempdb, over the period of investigation. If you need further details, such as their execution statistics and plans scroll up to the Top queries, and find the queries in the list. Using these two resources you can identify and tune expensive queries that make use of tempdb or spill to tempdb.
Track space use and IO metrics at the file level
The Files tab of the tempdb usage summary graph shows utilization of individual tempdb data files by class of object as well as performance metrics for individual tempdb files; specifically read/write volume and IO stalls.
If one file is being filled disproportionately you will observe more IO activity on this file, and potentially IO Stalls. You can also review the Files table of the Databases section of Server Overview page, filtered for tempdb, to verify whether each data file is equally sized and filling proportionally. If they are not, this may indicate a tempdb configuration problem.
In SQL Server 2016 and later tempdb will be created with a number of data files based on the number of logical processors detected on your machine, by default. When filegrowth occurs, SQL Server will grow all files to the same size at the same time to ensure all files remain evenly used. Finally, SQL Server will, as far as possible, allocate newly created tempdb objects their own extent. In versions of SQL Server prior to 2016, tempdb must be configured to replicate this behavior, creating additional data files (only one tempdb data file is created by default), and the same file growth and space allocation behavior must be enforced using trace flags (1117 and 1118, respectively). In older SQL Server versions that are not configured in this manner, or even on more recent versions that are misconfigured, you may find that tempdb becomes a serious bottleneck in busy periods, due to tempdb page allocation contention.
If you see IO Stalls in the Files tab across several data files then it may point to an IO bottleneck, either caused by the workload or ineffective indexing, or a configuration problem in the disk subsystem. For further evidence, review the Review the Top waits graph over the period of slowdown. The most significant wait types recorded over the period will tell you which resources processes were primarily waiting on, which might be locks, latches, network, disk I/O waits or something else. For example, if procedures or functions drive a high volume of disk IO to tempdb data and log files, you may see IO-related waits like PAGEIOLATCH or WRITELOG. Occasionally, you may see IOCOMPLETION waits, which is often related to creating and rebuilding large indexes with the SORT_IN_TEMPDB
option ON.
You will need to review the top queries list, sorted by IO, and investigate processes that are driving the IO and the extent to which they are using tempdb.
It could also be that the underlying disk subsystem simply cannot supply the required IO speed or throughput to support your tempdb workload. These files need to be located on drives with the highest write performance possible. Review the Optimizing tempdb performance in SQL Server section of the SQL Server documentation for additional storage guidance.
Advanced Investigation of tempdb issues
Sometimes it's easy to spot a rogue process that is excessively using tempdb. Other times, the root cause of the problem is harder to pin down and you'll need to dig deeper by reviewing the wait types that occur when performance declines or setting up custom metrics to track issues in more detail.
Do you have tempdb page allocation contention?
Up until SQL Server 2016, the biggest cause of tempdb contention was called "allocation bitmap contention". Briefly, it is contention between processes trying to access the different types of allocation pages of a tempdb data file: a SGAM page that identifies and allocates extents that have free pages and a PFS page that identifies unallocated pages, and tracks which pages are allocated to which objects. These issues can be observed on busy databases, with hundreds of concurrent queries that all create, use, and then drop small temporary objects in tempdb.
Page allocation contention is much less of a problem in SQL Server 2016 and later because tempdb is better configured during installation. In any case, Redgate Monitor will allow you to quickly verify, or "rule out", the occurrence of temdbp page allocation contention. Typical symptoms to look out for are as follows:
- The Top Waits graph of the period shows predominantly
PAGELATCH_UPandPAGELATCH_EXwait types, related to tempdb. - These are memory-related waits (not IO related) that occur when a thread must wait for access to a data page that is in the buffer pool, in this case one of the tempdb allocation pages.
- As reported in
sys.dm_os_waiting_tasks, these wait types would have an associatedresource_descriptionof 2:1:1 or 2:1:3 (dbid:fileid:pageid), indication the tempdb allocation pages. - The tempdb usage summary shows high use of tempdb.
- Evidence of a instance-wide drop in throughput (such as a drop in the transactions per second metric across several user databases).
- On the Server Activity graph, CPU, IO, and Memory do not generally appear to be limiting performance.
The solution is to ensure that there are an optimal number of tempdb data files for the number of logical processors on your machine and the files are being used evenly. See the Microsoft documentation for guidance: Physical properties of tempdb in SQL Server.
There is another, less common, form of tempdb contention, called metadata contention, that is caused by competition for tempdb pages that belong to the system objects that SQL Server uses to track each temporary object's metadata. The symptoms are very similar: you'll see the PAGELATCH_XX wait type but this time the pages will belong to be one of the system objects. This issue is not resolved by adding more tempdb files, as the system objects are one per database, not one per file. Aside from tuning code to optimize tempdb use, and reduce the number and frequency of object creations, you might consider use of Memory-optimized table variables (SQL Server 2016 or later) or enabling Memory-Optimized TempDB metadata (SQL Server 2019 and later).
Analyzing baselines for tempdb metrics
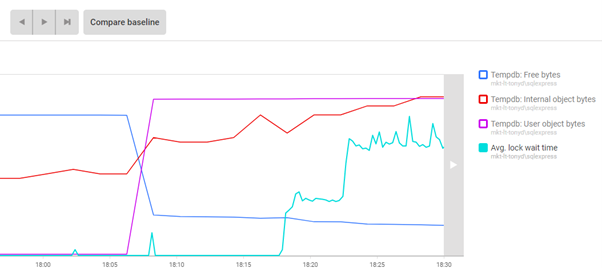
All of the tempdb-specific metrics reported in the tempdb usage summary graph, and the more general performance metrics and disk space and disk activity metrics, can be plotted on an analysis graph.
Once you've displayed the metric activity you're interested in, you can compare that activity with a baseline to identify unusual patterns of behavior.
For example, you can review current activity and baselines for the virtual file statistics reported in the Files tab of the tempdb usage summary alongside other disk IO metrics such as disk transfers/sec, Average Disk Queue Length, and disk avg. read and write times. You could also correlate this with key performance metrics from user databases to see if periods of slowdown corelated with signs of tempdb pressure.
Installing custom metrics for tempdb
Depending on what your basic diagnosis reveals, you may consider installing custom metrics to track the occurrence of certain issues. For example:
- Hash warning in last hour and Sort warnings in last hour - these metrics capture the hash_warning and sort_warning events, from the default trace, to alert you when hash or sort operations spill to tempdb on disk.
- Average IO Stalls – potentially useful if the Files tab of the tempdb usage summary regularly shows IO stalls
You can also consider creating custom metrics based on an Extended Event session. See for example:
- Improve tempdb spill diagnostics by using Extended Events
- Monitoring tempdb growth
- Monitoring TempDB Contention using Extended Events and Redgate Monitor
Best Practices for avoiding tempdb problems
Firstly, ensure the tempdb is correctly configured for your system, and for your workload. Review the Optimizing tempdb performance in SQL Server section of the Microsoft documentation for advice.
Depending on what your investigations reveal, you may need to tune queries that use tempdb heavily or fix specific problems such as spills to tempdb on disk.
Control and optimize explicit use of tempdb
- Look out for use of temporary tables and variables holding more data in them than is ever used, often comparing millions of rows of data, to return a small subset of results - these are often easy to fix by devising a suitable filtering WHERE clause.
- Avoid iterative constructs in the code within which a table variable is created, used, and deleted. It is usually easy to reengineer the code to use a single temporary table.
- Try to break down complex queries into a series of well-defined steps, storing intermediate results in a set of explicit temporary tables. This makes tempdb usage patterns more predictable. Also, these tables can be indexed, if needed.
- Index temp tables appropriately (after loading) if you need to perform a lot of data processing, possibly with a columnstore index, depending on workload, to get batch mode processing. See: SQL Server Execution Plans, 3rd Edition, Chapter 12: Batch Mode Processing.
- Understand the "rules" for using table variables or temp tables for storing intermediate results during processing, and when one will give better performance than the other. See: Choosing Between Table Variables and Temporary Tables (ST011, ST012)
- Avoid use of "wide" table value parameters. See: Troubleshooting Tempdb, a Case Study
- Create table variables and local temporary tables in a module, such as a stored procedure, so they can be cached, especially if tempdb contention is a known problem on the instance. Similarly, use parameterized queries when working with table-value parameters. See: Use Table-Valued Parameters
- When loading large temp tables, consider strategies that allow parallel inserts and minimal logging. See: Making The Most Of Temp Tables Part 1: Parallel Inserts
Avoid spills to disk
Generally, operations that require sorting or use or worktables and workfiles will be performed in memory. Spills to disk, happen when the query optimizer has inaccurate knowledge (or no knowledge) of the volume or distribution of data in a column. The optimizer devises a plan for a query and the memory grant for each operator in the plan will reflect how many rows it estimates it will return. When the row estimate is low, the memory grant will be insufficient, and SQL Server spill the operation to disk. For example, when an inadequate amount of memory is allocated for a sort operation, data can spill to disk.
You can also experience performance problems with hash joins if the build input is much larger than the optimizer anticipated and spills to disk (called hash recursion). Of course, spills to disk can occur when working with temporary tables and variables too, such as when performing join operations between temp tables that lack a Primary Key or indexes.
Possible actions:
- Effective indexing on columns used frequently searches on large tables, and on join columns - generally reduces amount of data returned, gives optimizer accurate statistics, and often avoids the need for explicit sorts.
- Maintain statistics on important indexes
- Ensure appropriate constraints and keys - for the useful metadata these make available to the optimizer, such as the uniqueness of a column.


