Top 10 queries
Published 07 October 2020
SQL Monitor collects data from various sys.dm_exec_* dynamic management objects to provide details of significant user and system requests that execute on the SQL Server instance over time, their details (SQL Text and execution plan) and their query execution statistics (number of times the query has been executed, and averages for duration, CPU time, I/O activity, and so on).
It displays this data in a Top x Queries table, showing the most expensive queries recorded over the period indicated by the focus window on the interactive timeline with execution statistics and query details. For each query in the list, you can see:
- Query Execution statistics – you can sort the list by Execution count, Duration (ms), CPU time (ms), Physical reads, Logical reads, Logical writes, or Database, which will repopulate the list and sort it by your chosen criteria.
- SQL Text and graphical execution plan – and the plan handle to get it from cache.
- Associated waits – any resources the query had to wait to access.
- Query history graph – shows any changes in plan over the period.
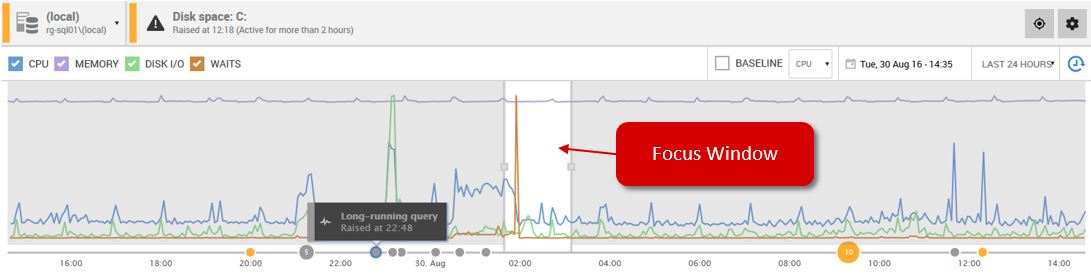
By default, the Top 10 Queries (and Top 10 waits) tables show data for the graph focus window. This means we can correlate what we see in the interactive timeline, with performance statistics and execution details for queries, recorded over the same period, which were the principle resource consumers:
You can also display data from a previous time period of your choice using the Back in Time control. For more details, see: Rewinding time with Back in Time mode.
If data isn't available for the selected time period, it may have already been purged from the Data Repository. See: Why is data missing? below.
Top 10 queries table
See the Expensive Queries video demo of how to use the Top 10 Queries table, at Redgate University.
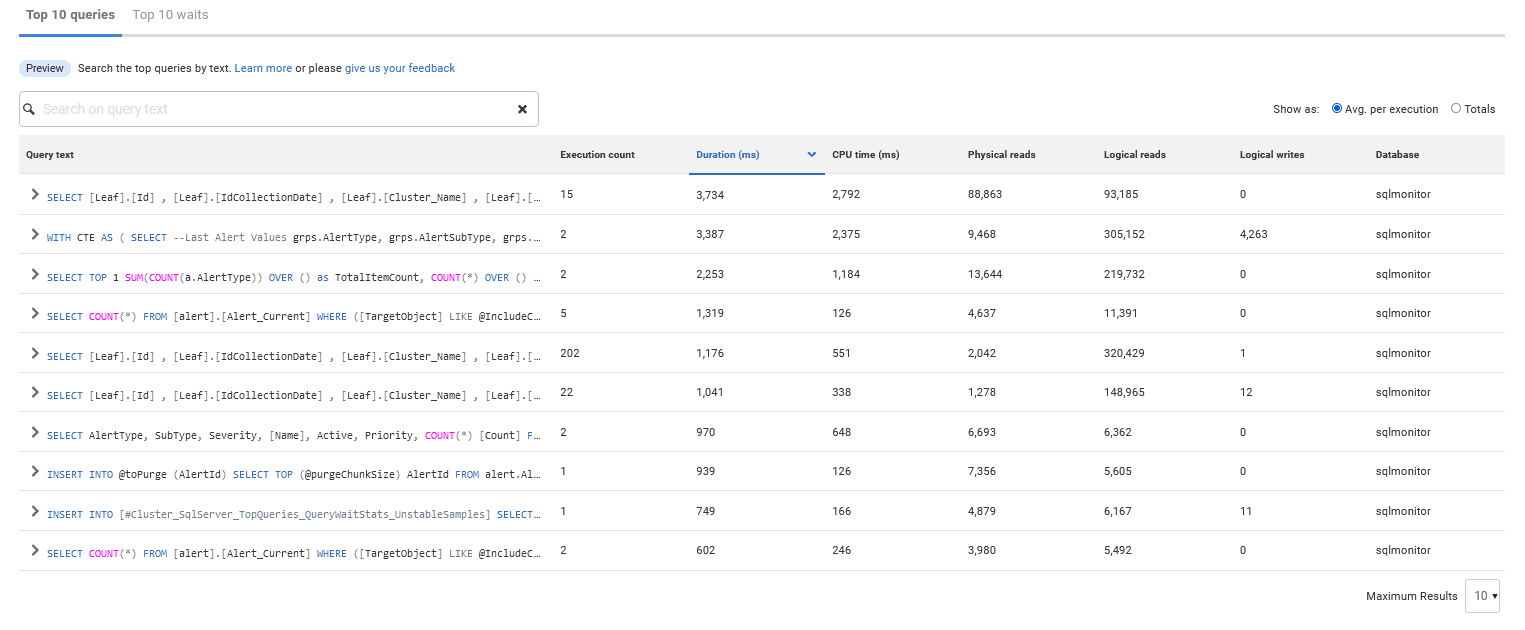
The Top 10 Queries table shows the queries that used the most resources during the selected time period. The data is updated automatically every 60 seconds.
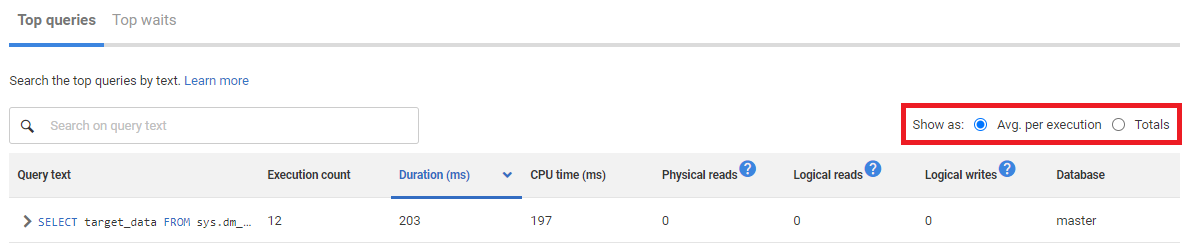
By default, Avg. per execution is selected; this lists queries based on average values over the time period selected. Click Totals to display queries based on total values:
The table shows:
- Execution count – number of times the query was executed.
- Duration – how long it took (in milliseconds) to execute the query. By default, queries are listed in descending order according to this metric.
- CPU time – how much processor time (in milliseconds) was used to execute the query.
- Physical reads – the number of times a page is read into the buffer cache. If the page is in the cache already, it uses the page already in memory and does not generate a physical read.
- Logical reads – the number of times the database engine requested a page from the buffer cache.
- Logical writes – the number of times data is modified in a page in memory. If a page stays in memory for an extended period, more than one logical write may be required before it is physically written to disk.
- Database – the database the query was run against.
To update the table manually, click on a column header containing numeric data.
Selecting one of these options does not simply change the sort order of the existing list of queries. A new table is generated according to the selected option, so different queries are likely to be displayed.
Click on a query to show the query statement, the latest query plan handle, and a list of waits that had the greatest impact during query execution. See the next section.
Top Query Search

The search feature will allow you to search for terms in the query text to narrow down the results you get in the Top Queries Table.
As SQL Monitor will only sample queries that have met one of its minimum execution conditions you will be unable to locate data for queries below these thresholds even using the search. We would like to hear from you if this is the case to identify the use case and help prioritize further development of this feature.
The following wildcard characters can be used in the search term but cannot be specifically matched (e.g. a search containing "select *" would match any query that contains select):
- * - Matches any number of characters
- ? - Matches a single character
Limitations on search parameters
- The search parameter can only positively identify alphanumeric characters. Other characters will be discarded from the search term (e.g. search containing "select name from customer where id = 1" will match on id and 1 but will ignore the = character)
Viewing query details
Click on a query to show the Query details page:
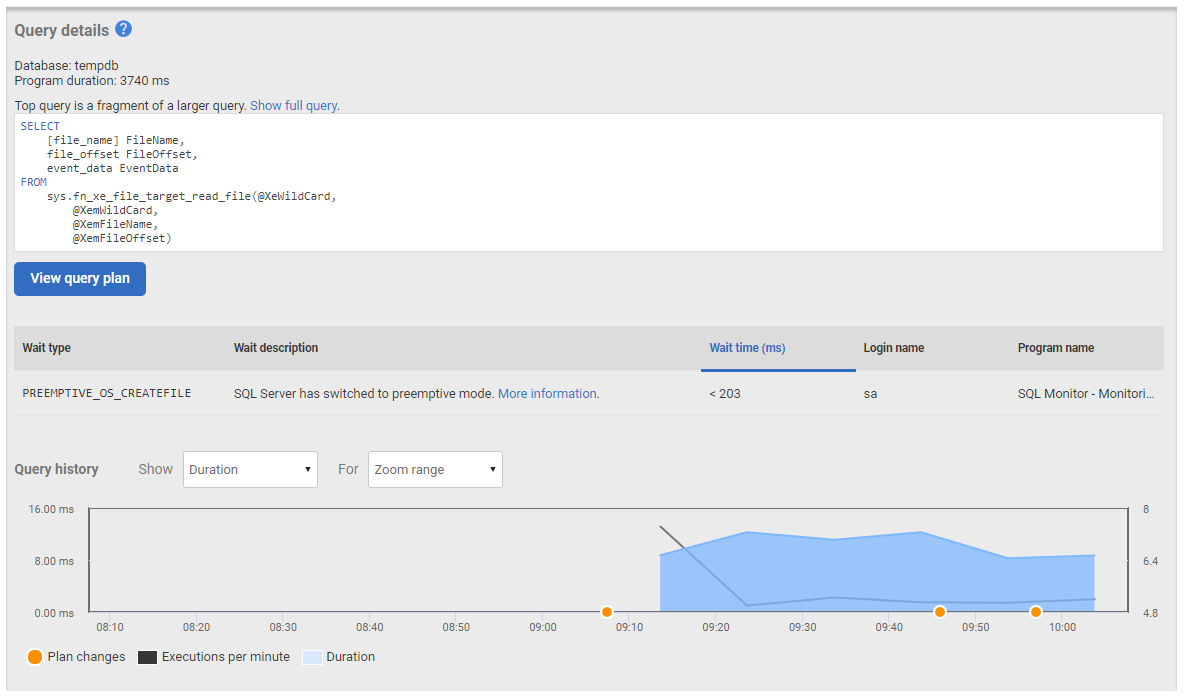
The page shows:
- The latest query plan handle, the query to retrieve it from sys.dm_exec_query_plan, and a button to show the full graphical query plan.
- The name of the database against which the query was run.
- The total query duration – this is the query's average duration multiplied by execution count. The result can be less than the total wait time if the query was processed using multiple threads. This commonly occurs in environments with multiple CPUs, or those using parallel executions.
- The full SQL Text of the query.
- The waits that occurred during query execution. Click on a wait to display further details below the Top Waits table. See: Viewing wait documentation.
SQL Monitor samples the wait time data and returns an approximate value. Hover the mouse pointer over the wait time to display a tooltip containing the margin of error. For example:
If the margin is between 20% and 40%, the value is preceded by a '~' tilde character:
If the margin is between 40% and 100%, the value is preceded by a '<' less than character:
- Query history graph – this data is taken from SQL Server Query Store and highlights changes in query behavior as they relate to changes in execution plan. See Using the Query History graph,
Expanding query details
Click on the ![]() arrow below the query statement. The top half of the page expands and the content changes:
arrow below the query statement. The top half of the page expands and the content changes:
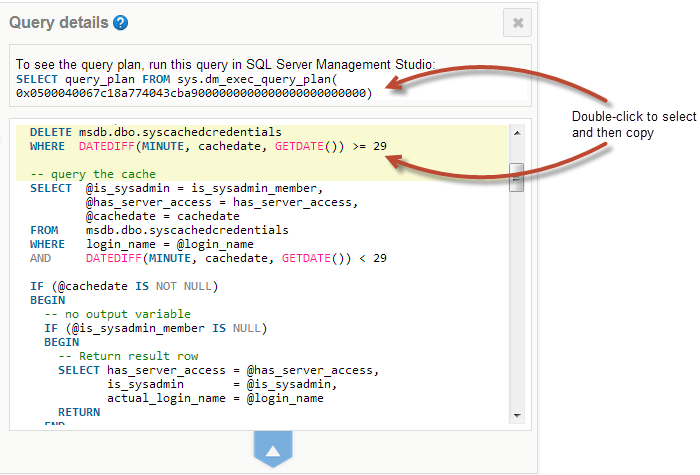
You can now see:
- An expanded query statement that includes the full contents of the batch from which it originates. The statement affected by the wait is highlighted in yellow.
Double-click to select and then copy the batch so you can execute it in SSMS.
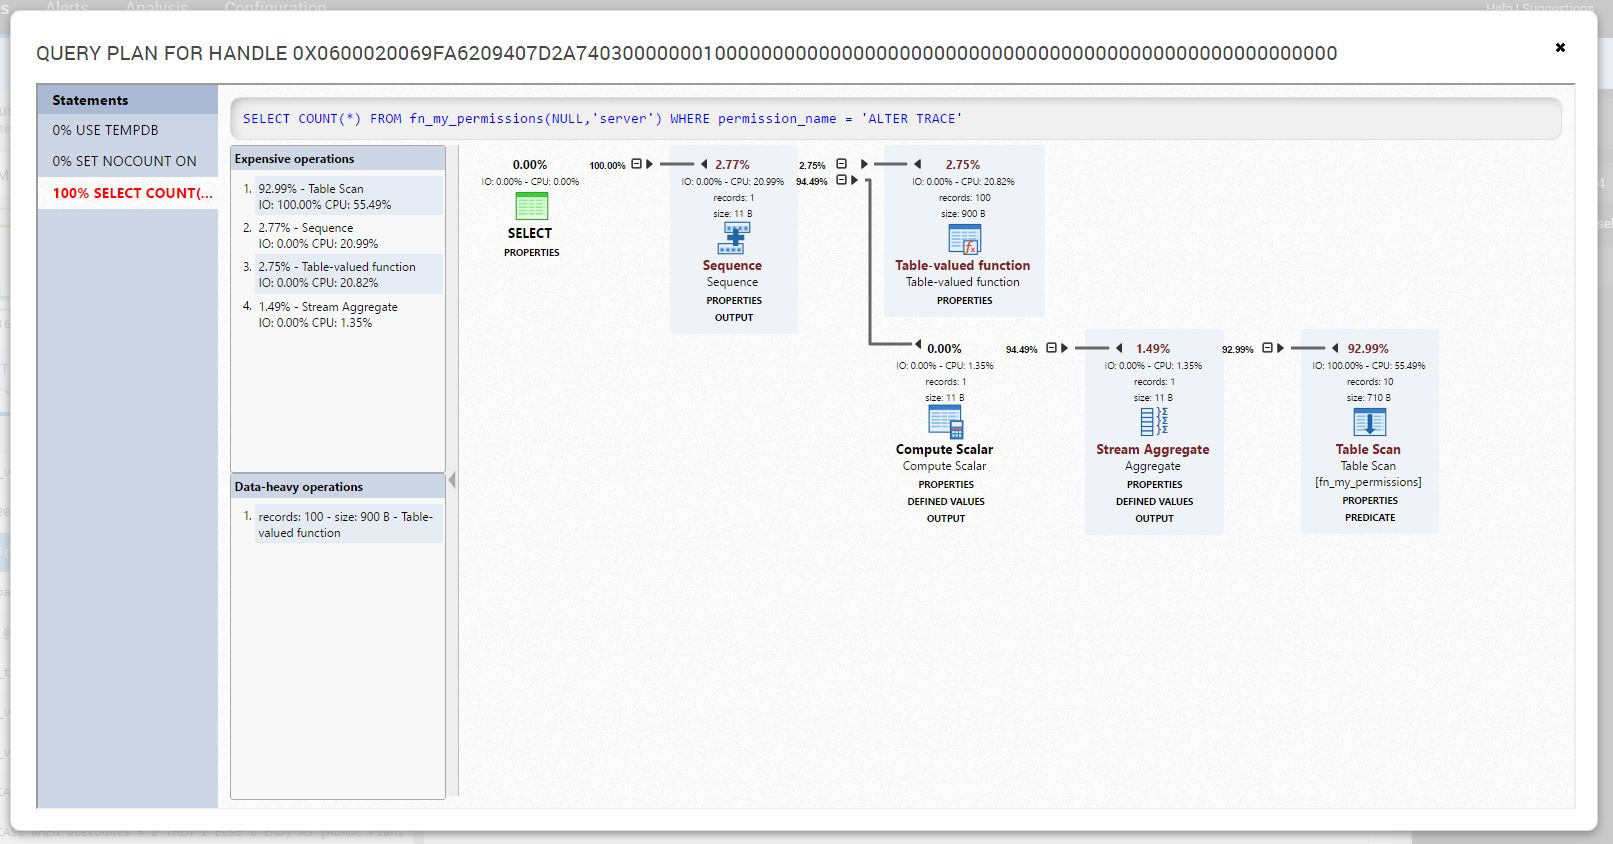
Viewing the query plan
Click the  button to view the query plan for the associated query.
This will bring up the query plan explorer:
Using the Query History graph
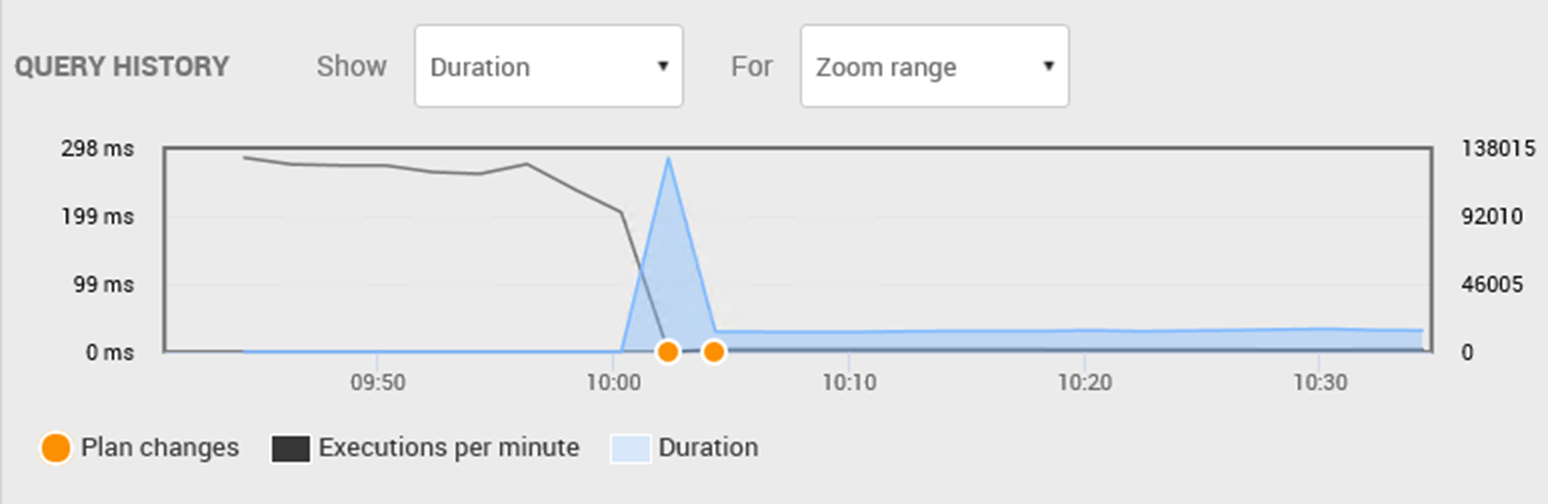
The execution plan changes that occurred at 10AM in the above graph, are indicated by the orange Plan changes circles.
Also around 10AM, the number of executions of this query, per minute, has fallen from somewhere in the range of 100,000 every minute to something much less. See the exact details by hovering the mouse over the dark line representing Executions per minute, to get a pop-up detailing the information captured:
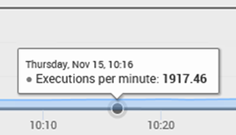
So, instead of 100,000 executions a minute, we're only getting about 2,000. While the cause might be completely benign, such as that an application simply stopped calling the procedure, it might alternatively be the problem that explains why your boss and the CTO just showed up in your cube. Let's gather some more metrics so we can give them the story.
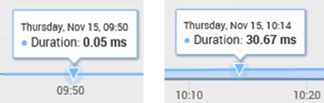
Hover over the Duration line, at a time shortly before and shortly after the change in behavior to the impact on average query duration. Here, we see an average duration of 0.05ms before the change in plan and, once the spike up to 298 ms has subsided, the query settled out at a consistently longer duration of about 30 ms:
Right-click on each of the plan changes to see what plan was implemented at each point. If we choose the second of the two, you will see the plan currently in use (which you can confirm by selecting View Query Plan in the query details).
See the Product Learning Article Why is my query suddenly slow? for further details of this feature and an example.
Code analysis
SQL Monitor identifies deviations from SQL query best practices using the Code Analysis library it shares with SQL Prompt. Addressing these issues will improve the overall quality of the query and can improve execution performance. Learn more about the rules that SQL Monitor uses in the Code Analysis for SQL Server documentation page.
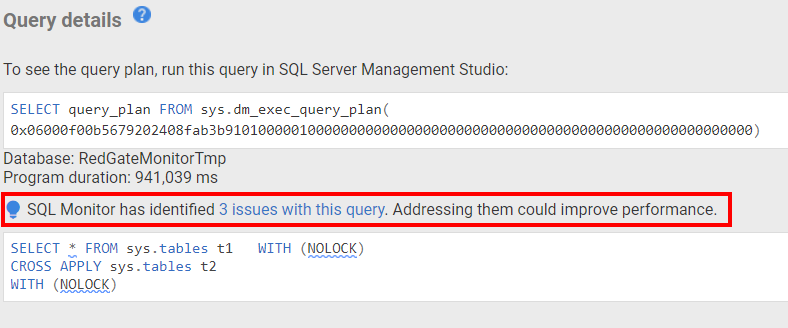
Clicking the link with the number of identified issues opens a window with details:

Why is data missing?
Queries or waits may not be available for the selected time period for any of these reasons:
- There was no significant data to capture.
- The data has been purged.
- SQL Monitor wasn't running.
- The database was unavailable or suspended.
- SQL Monitor couldn't sample the data.
See also
The following Product Learning articles will help you understand how to use SQL Monitor's metrics, alerts and performance diagnostics to investigate query performance problems:
- Troubleshooting a painful query using execution plans in SQL Monitor
How to use SQL Monitor to identify an unusual set of behaviors on the server, then narrow down the cause of the behaviors to a particular query. Why is my query suddenly slow?
The performance of a query has suddenly changed, for no obvious reason. With SQL Monitor, you can study the query history, get the "before" and "after" plans, diagnose the cause.Investigating problems with ad hoc queries using SQL Monitor
Phil Factor demonstrates the performance problems that overuse of ad hoc queries can cause and then how SQL Monitor can warn us when they are the cause of these problems on your SQL Servers, using built-in metrics such as SQL Compilations/sec metric and Batch Requests/sec.
Next step
This documentation contains proprietary information and is protected by copyright law.
Copyright © 2026 Red Gate Software Limited. All rights reserved


