Step 2. Add alert
Published 09 February 2026

Adding an alert to a custom metric is optional, but it means you'll be notified if the metric value passes certain thresholds and durations.
Enter custom alert details
Alert name
Adding an alert name is compulsory, because it is the unique identifier for that alert in Redgate Monitor. The name can contain up to 255 characters.
Alert description (Optional)
The alert description is optional but recommended because it helps users understand what conditions may cause the alert to be raised. It is displayed in the Description tab on the Alert details page and the Description section on the Alert configuration page.
Additional alert text query (Optional)
If you would like the alert to display a contextual value that would be helpful when responding to the alert, enter a query designed to capture that value alongside the metric value. The returned value is displayed alongside the metric value in the Alert details page.
For example, to display context about recently added records in a relevant table called Orders, your query could be:
Example query
SELECT CONCAT('Latest OrderID: ', MAX(ID))
FROM dbo.Orders
When writing your query, follow these guidelines:
- The statement you provide must return a single string value.
You do not need to specify which databases to query. The T‑SQL used to capture the Additional alert text runs against each database you selected during the Configure metric step.
Do not enter:
Any statements that modify the database, such as INSERT, UPDATE, DELETE, DROP, CREATE, or ALTER.
Queries that could impact normal database performance or place unnecessary load on the server.
- Any queries or stored procedures that BEGIN or ROLLBACK a transaction.
Validate the query
To prevent causing damage to your servers or data, we recommend that you validate and run the query against a non-production database in your SQL Server management software before adding it to Redgate Monitor.
For Oracle custom metrics, additional alert text is not configured as a separate query. Instead, include an optional third column called alert_detail_text in your main metric query. This column should return a string value providing context for the alert.
Define alert thresholds
Redgate Monitor needs to know whether you want to be alerted when metric values go higher or lower than your defined thresholds, so that it knows the direction in which alerts should be raised and escalated.
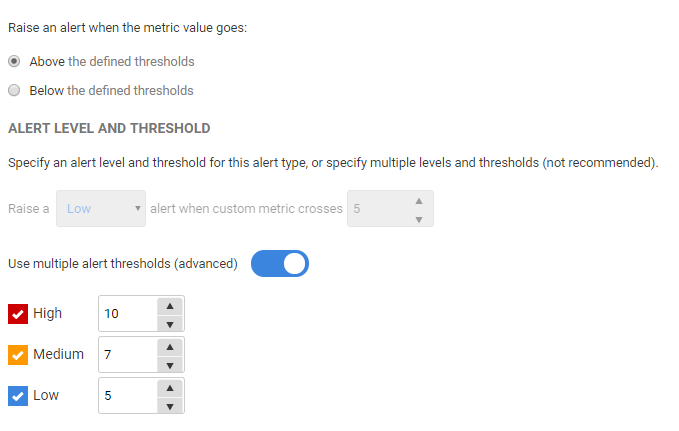
- In most cases, you want to be alerted when values go higher than the threshold, so Above the defined thresholds is the default selection. The alert will only be raised or escalated if the value increases. For example, an alert based on database size may be raised as Low if it passes a 5 GB threshold, then escalated to Medium if it increases and passes above a 7 GB threshold:
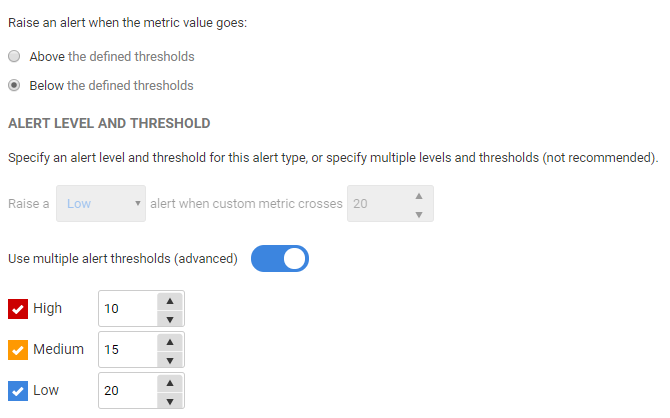
- In some cases, you want to be alerted when values go Below the defined thresholds. For example, to raise alerts when the amount of disk space available falls below a certain size may be raised as Medium if it passes a 15 GB threshold, then escalated to High if it decreases and passes below a 10 GB threshold.
You do not have to enable every threshold, but you must add values to the enabled levels. In the Alert Inbox, the alert level will change automatically as the different thresholds are passed. This allows you to keep track of how serious the problem is, and to prioritize queries for investigation that have escalated to High.
If initial threshold settings don't suit your environment when put into practice, you can change them using the alert configuration page.
Set alert threshold duration
By default, alerts are raised every time the metric passes the defined thresholds. Sometimes this behavior isn't ideal, for example when you're collecting metrics every minute from a database for which occasional spikes are normal. You want to see these spikes on the analysis graphs, but you don't want them to trigger an alert unless the threshold is passed for three or more consecutive collections.
To change the default behavior, add a suitable value to the Raise an alert when the threshold is passed for <n> collections option. Text displayed in this section confirms the metric collection frequency specified in Step 1. Defining the metric, and the total time range after which alerts can be raised:
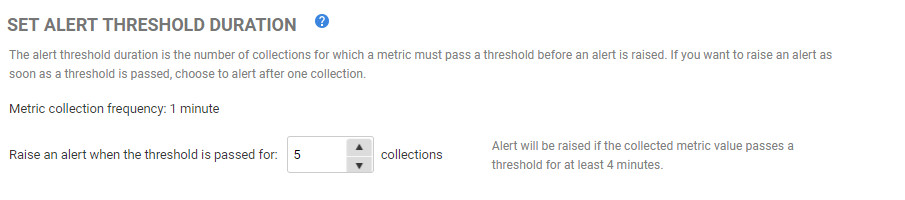
Alerts can only be raised if the metric passes a threshold value at the time it's collected. If a spike occurs between collections, they won't be displayed on the analysis graphs and can't trigger alerts. If you suspect spikes are occurring outside collection times, consider editing your custom metric configuration to collect data more frequently.
This documentation contains proprietary information and is protected by copyright law.
Copyright © 2026 Red Gate Software Limited. All rights reserved


