Connecting with PowerBI
Published 10 April 2024
Connecting to an endpoint in Power BI
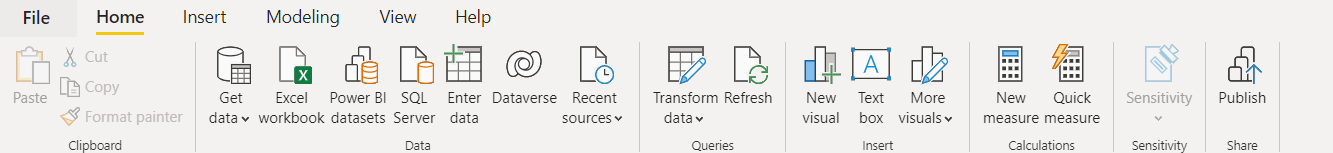
1. In Power BI, click Get data.
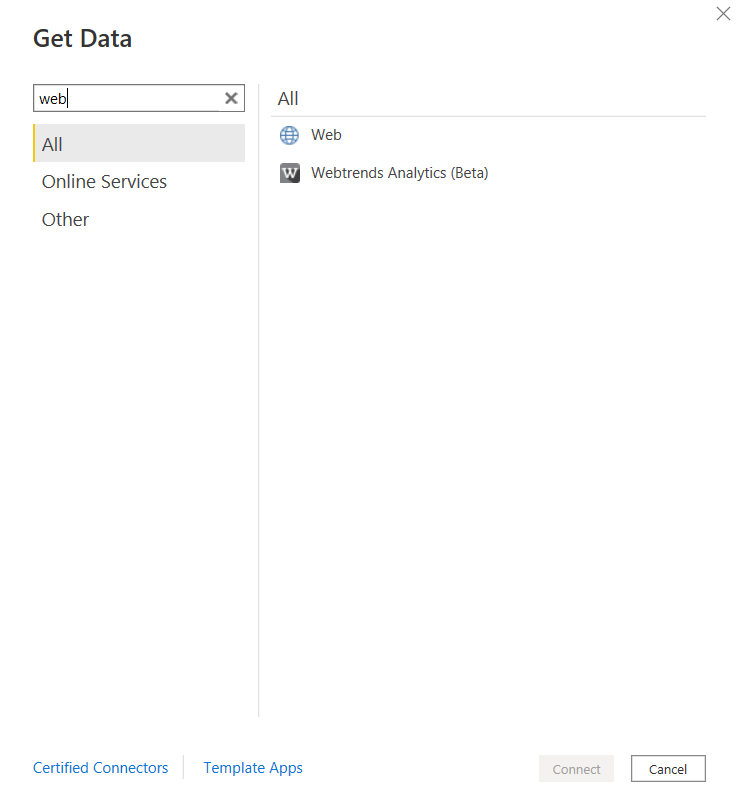
2. Select Web from the pop-up window and click connect
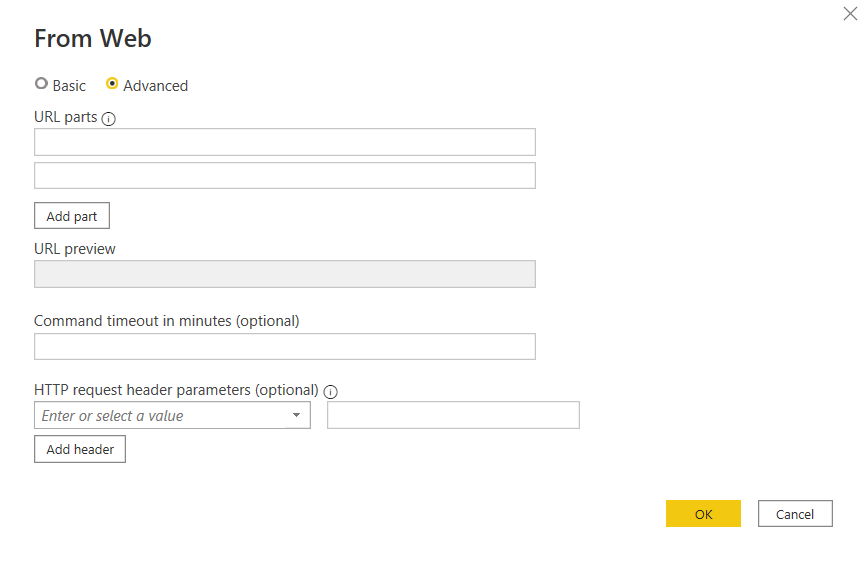
3. From the next pop-up, select Advanced
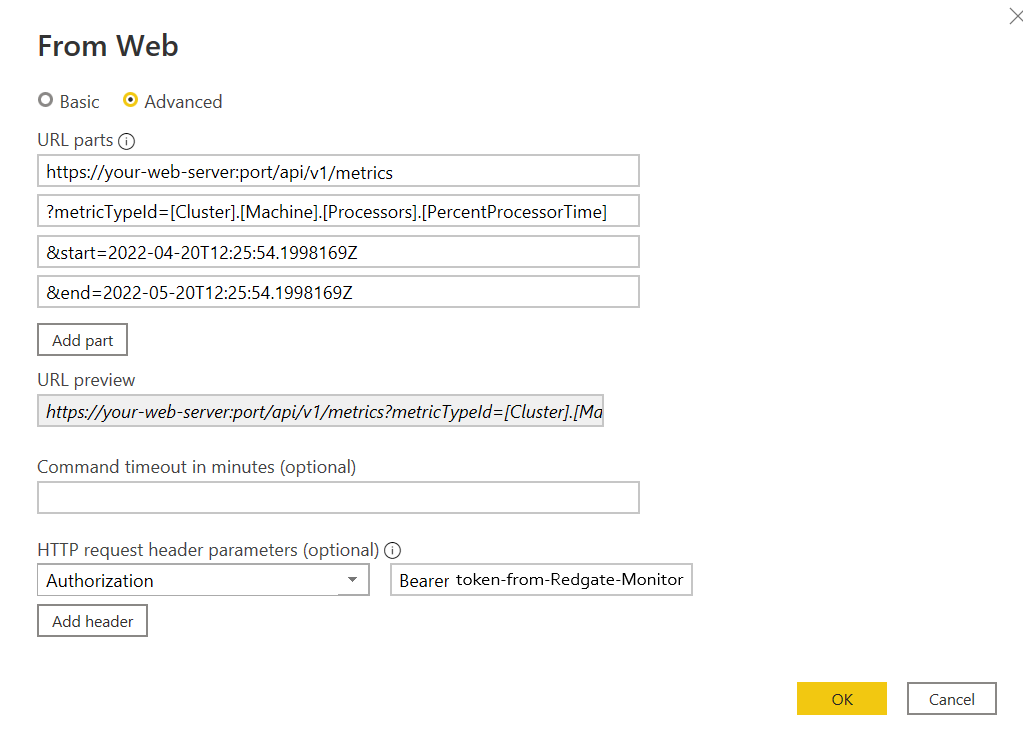
4. Enter the URL for the endpoint you wish to use. As an example, let us consider the Metrics endpoint. This endpoint has 4 query parameters, 3 of which are specified.
An Authorization HTTP request header also needs to be specified. This is mandatory as Power BI will not be able to connect to the endpoint without it. The value of this Authorization header would be Bearer {token-generated-from-Redgate-Monitor}, where {token-generated-from-Redgate-Monitor} is replaced with the character sequence generated by Redgate Monitor as an authentication token.
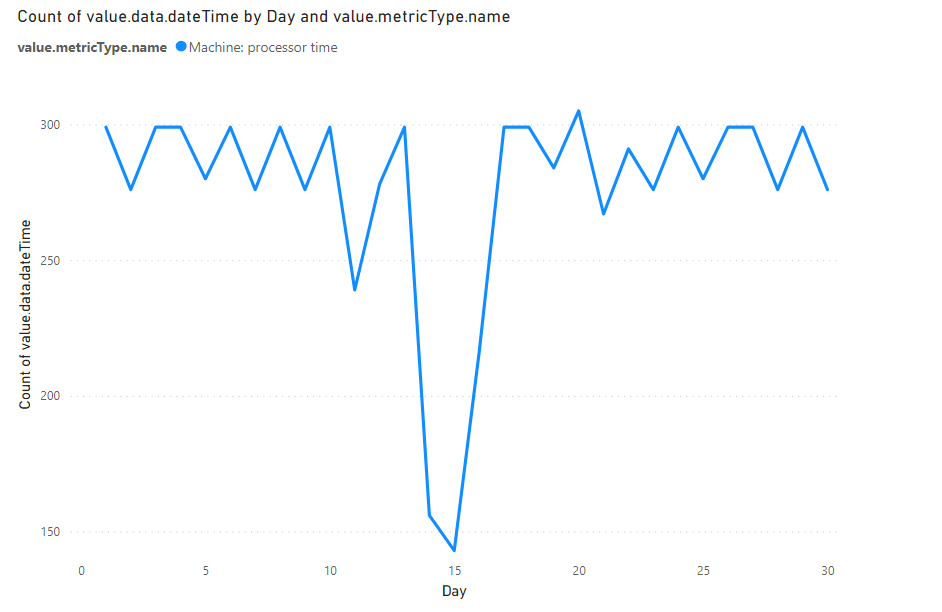
5. After specifying the necessary query parameters, click OK to continue. This will load the Metrics data into a table. Using this table, the data can be visualized in any form, for instance, a line chart.
This documentation contains proprietary information and is protected by copyright law.
Copyright © 2026 Red Gate Software Limited. All rights reserved


