Customizing the alert settings
Published 28 March 2024
Configuring alert settings
Redgate Monitor provides alert types for each category of monitored object (machine, instance, Azure SQL Database, and so on). It provides sensible factory defaults for each alert type so that alerts can be raised as soon as you've installed the application.
For each alert type, we can configure various alert settings: we can enable or disable it, establish one or more alert severity levels, configure thresholds for each level, and specify the recipients of alert notifications.
Configuring custom metrics and alerts
This section describes how to configure the built-in Redgate Monitor alert settings. See: Custom metrics and alerts for details of creating and configuring those.
Changing the default settings (the All Servers level) for each alert type
Go to the Configuration page. Under Alerts and metrics, select Alert settings. To configure the settings for an alert type, simply click on it.
The Monitored Servers directory listing, on the left, sets the level in the server hierarchy at which the setting for the selected alert type will apply.
By default, you are at the All Servers level, so changing the alert settings for an alert type, will apply the settings to everything you're monitoring.
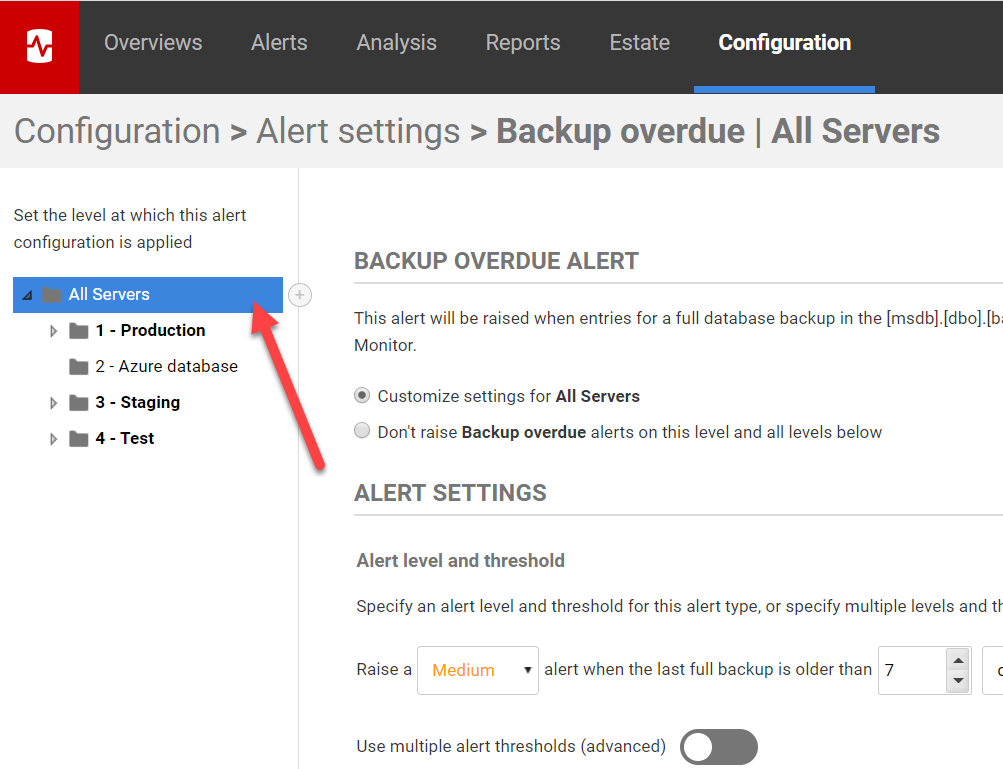
To adapt the alerts settings for specific servers, or groups of servers, see: Using the Monitored Servers hierarchy to customize your alerting strategy further down this page.
Which settings can be configured?
Go to the Configuration page. Under Alerts, select Alert settings. To configure the settings for an alert type, simply click on it. For each type of alert, you can:
- disable it, so the alert will not be raised in future.
- set the alert severity level, to either Low, Medium or High.
- change the thresholds for each alert severity level that raises an alert (certain alert types only).
- change the email recipient, and specify whether notifications should also be dispatched to Slack, SNMP channels or Webhook.
Once you configure the settings for an alert type, click Apply Changes.
Click Restore defaults to reset an alert type to its factory settings.
Disabling an alert
Most alert types are enabled by default for all servers when you first install Redgate Monitor. This should ensure that you're aware of any potential problems with your servers.
Select Disabled to stop raising alerts of the current type for the selected object. This will prevent any future occurrences of this type of alert appearing in the Alert inbox when the conditions that would have triggered this alert are encountered. The rest of the configuration options on the page are grayed out.
Click Apply changes near the bottom of the page. The alert is grayed out in the Alert settings page and the Enabled column displays a  disabled icon:

If you disable an alert type when there are currently Active alerts of that type, these alerts are automatically updated to Ended when Redgate Monitor next polls your servers.
Setting alert severity levels and thresholds
The alert types for Event alerts and any continuous alerts with a binary alert condition can be assigned one alert severity level, during configuration. Continuous alerts with a threshold condition can have multiple alert severity levels, with a configurable alert threshold for each level.
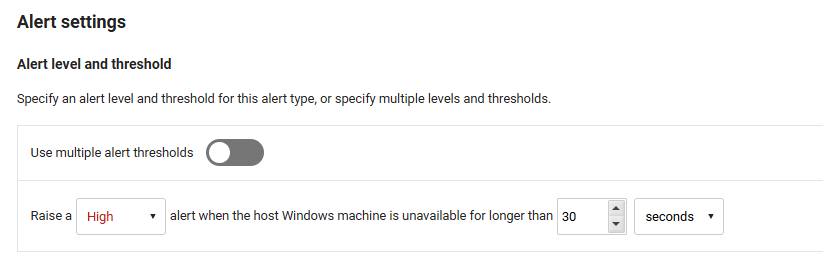
By default, Redgate Monitor only raises alerts at one severity – High, Medium or Low. You can change this severity to suit your priority levels.
For example, by default the Machine Unreachable alert is raised as a High alert if a machine is unreachable for longer than 30 minutes. In most cases, a DBA would treat this as priority and want to investigate it immediately. For some groups of server, or individual servers, you may want to drop the level to Medium or Low, so that you can filter them out when viewing your most critical High-level alerts.
Enabling multiple alert thresholds and alert escalation
Some types of alerts have multiple thresholds that you can match to Low, Medium or High severity level. To view and enable multiple thresholds, click the Use multiple alert thresholds toggle.
If you choose to enable multiple thresholds, the alert is raised when it passes the lowest-defined threshold, and can then escalate to a higher level when it passes another threshold. You don’t have to enable all three levels.
In the example below, the Long-running query alert is configured to be raised as a Low alert after 1 minute, to be automatically escalated to a Medium alert after 2 minutes, and then to High after 5 minutes. When the query finally ends it will be marked as Ended.
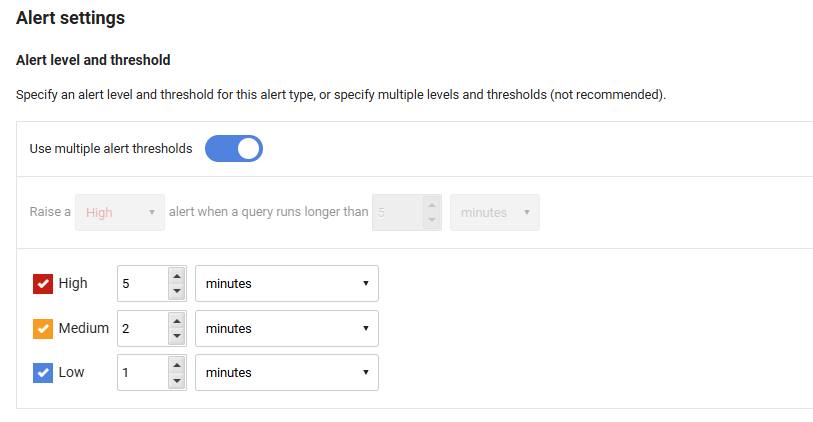
In the Alert Inbox, the alert level will change automatically as the different thresholds are passed. This allows you quickly to keep track of how serious this problem is, and prioritize queries for investigation that have escalated to High.
In the example below, only the Medium level has been enabled for the Blocking process alert. In this case, no alert will be raised until the block lasts for at least 2 minutes, and the alert will be raised as Medium. It will remain as a Medium alert however much longer the block lasts. When Redgate Monitor detects that the block is over, the alert is marked as Ended.
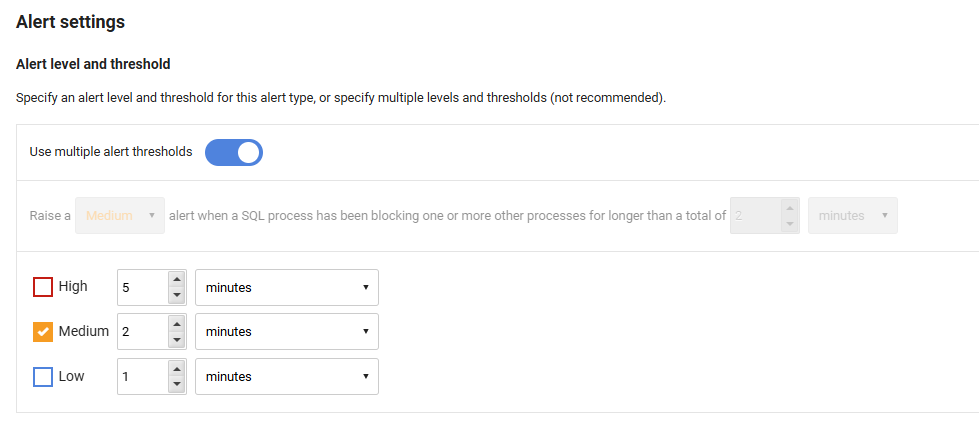
You can see that the thresholds are multiples of 15 seconds in both examples. Redgate Monitor only collects data about most problems on your servers every 15 seconds.
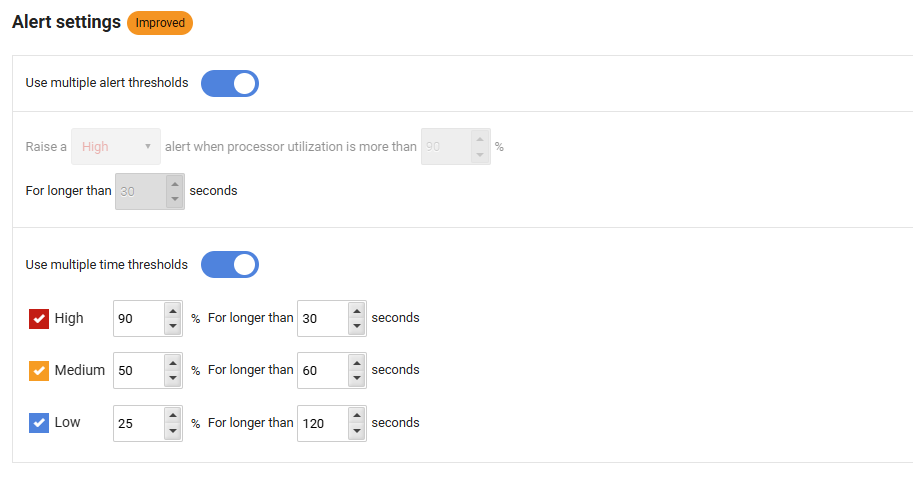
Enabling multiple alert and time thresholds
Some types of alerts have multiple time thresholds that you can match to Low, Medium or High severity levels. To view and enable multiple time thresholds, click the Use multiple time thresholds toggle.
If you choose to enable multiple time thresholds, the alert is raised when it passes both the lowest-defined alert metric threshold & time threshold, and can then escalate to a higher level when it passes another set of thresholds.
In the example below, the Processor (CPU) utilization alert is configured to be raised as a Low alert after CPU utilization hits 25% for longer than 120 seconds, to be automatically escalated to a Medium alert after 50% for longer than 60 seconds, and then to High after 90% for longer than 30 seconds.
Excluding specific alerts
For some alert types, we can use regular expressions to exclude certain objects from the alerting strategy. For example, for the Job Duration Abnormal alert type, we can exclude jobs named after a certain pattern. For the Long Running Query alert type, we can exclude alerts for certain processes, SQL commands or object, or for certain databases.
Configuring email notification
Until you set up your mail server settings in Redgate Monitor, no emails will be sent regardless of the settings you apply on any Alert settings page.
To enable email notification across the application, go to Configuration > Notification settings (see Setting up email notification).
Then, on the bottom of each Alert settings page, specify the notification settings you want for that alert:
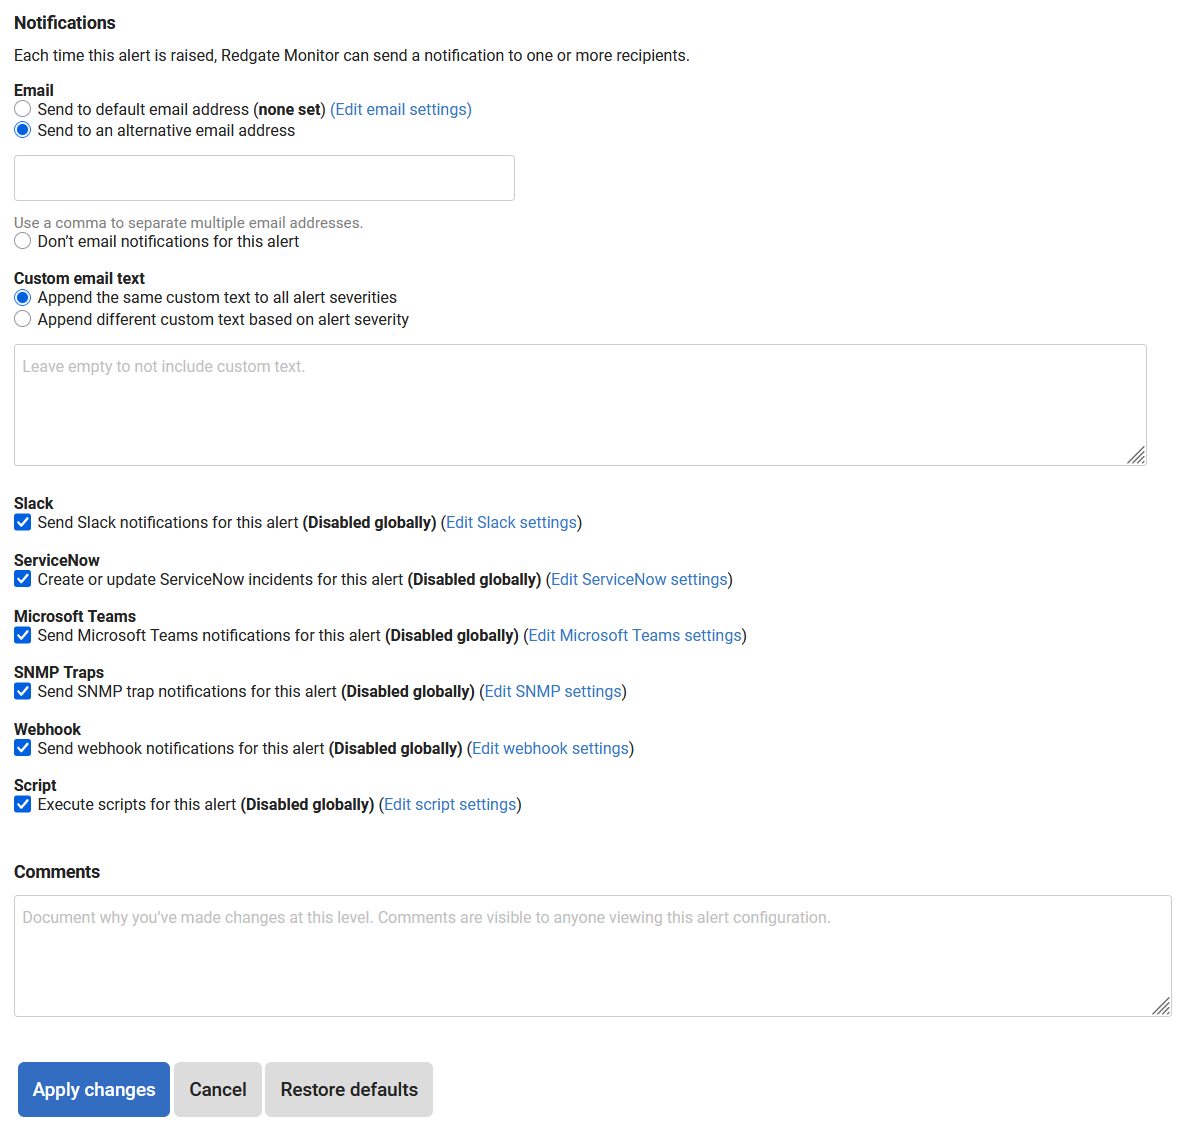
There are two options for sending email notifications:
- Send to default email address
Sends email notifications for this alert to the email address entered in the Send emails to box on the Email settings page. If you edit the global email address on the Email settings page, then this alert will automatically pick up the new global setting. - Send to alternative email address
To send emails for this alert to one or more recipients, type the email addresses you want in the box.
You can also specify here whether notification for this alert type should be sent to Slack, SNMP channels or Webhook. Again, these channels must be configured in advance. See Configuring alert notifications.
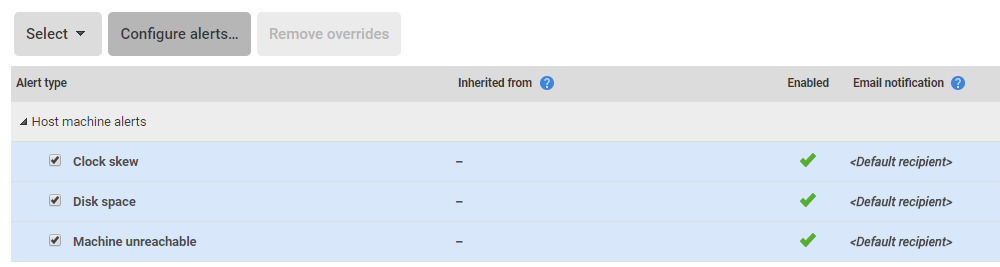
Configuring multiple alerts at once
If you wish only to enable or disable several alert types, or change the email alert notification properties for a set of alert types, then select each alert type using the checkboxes or the Select drop-down list, and click Configure alerts:
Configurable thresholds either don't exist or vary greatly for certain alert types, so these changes must be carried out on an individual basis.
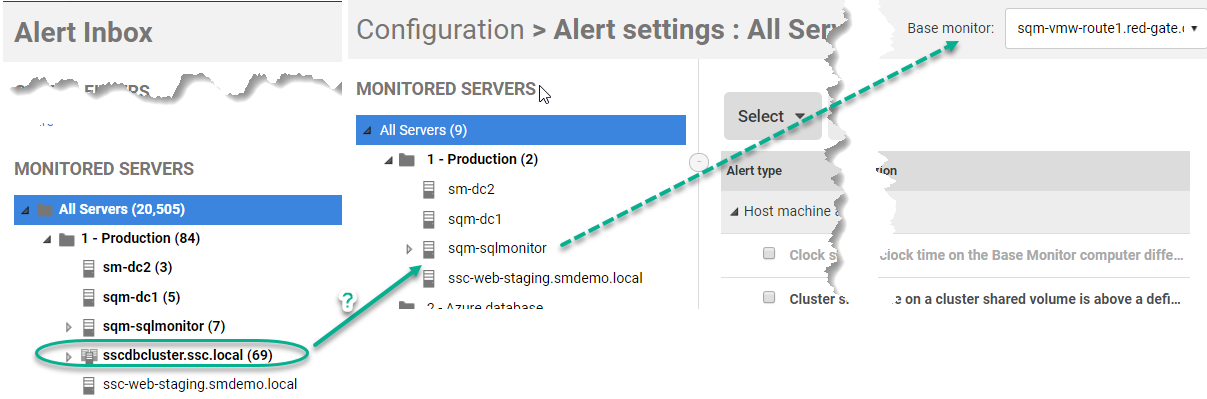
Configuring alerts when there is more than one Base Monitor
In contrast to the Alert inbox, as well as the Overview pages, which show monitored servers for all Base Monitors, the Configuration page for the Alerts and metrics applies per Base Monitor. The chosen alert types and their settings will apply to all monitored servers that belong to the specified base monitor. Therefore, if you have an advanced Redgate Monitor architecture, within multiple base monitors, you will see in the Alert inbox alerts for monitored servers that may initially appear to be "missing" from the Alert Settings page, for example, but in fact just belong to a different Base Monitor.
Using the Monitored Servers hierarchy to customize your alerting strategy
Alert settings are applied in a hierarchy; an object inherits its alert settings from the level above in the hierarchy. For example, a database inherits its settings from the instance, which in turn inherits settings from the host machine, which inherits from the group to which it belongs. When you first add a server to monitor, it inherits the default alert settings for every type of alert from the All Servers level of the Monitored Servers hierarchy, which is the highest level.
However, we can customize alerts across groups of objects (all databases on an instance, all servers in a group) as well as at various other levels in the hierarchy (for example, a specific server, job or database), as required. For example, the factory setting for the Long-Running Query alert type is to raise an alert if a query runs longer than 10 minutes. However if, at the machine level, you change that setting to 5 minutes, then it will apply to every instance on that machine. However, other machines will continue to use the factory settings.
Customizing the alert settings by Group
It is a best practice in Redgate Monitor to create Groups of servers that are likely to require the same alerts and thresholds, and the same notifications and email addresses. By using Redgate Monitor Groups and assigning whatever you are monitoring to an appropriate Group, you can more easily apply similar alert configuration settings to servers. You can add machines or clusters to a Group (but not, currently, individual instances). Once you have assigned your servers to a group, you can use it as a filter for Alert Inbox and you can configure alert settings at the group level.
You can move one group into another so that it becomes a subgroup. Each subgroup inherits all alert settings from the group above, but you can override the inherited value for that subgroup so that each group in the hierarchy can be customized separately. An obvious use for this would be to assign a different contact address, for the alert recipient, for different subgroups of production servers. You would just create as many subgroups as you need and tweak the notification settings for the subgroup. You then move the server between subgroups according to who is to receive the alerts.
To configure an alert type for a group, select the group from the Monitored servers list. Everything in that group inherits these settings unless they have been specifically customized at a lower level.
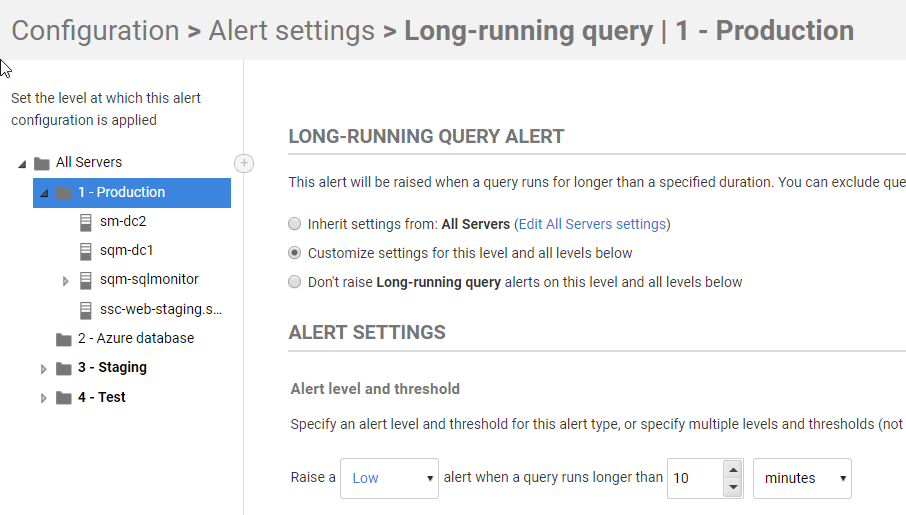
Click on the alert type in the list that you want to edit. The level from which the selected object currently inherits its settings for this alert type is displayed at the top of the page.
Select Customize settings for this level and all levels below to configure this alert type for the current level and all levels below it. Once selected, the other options on this page become available. After you have customized a particular level, this level will not inherit subsequent changes made to the levels above, including changes applied at the All Servers level.
In the following example, I am customizing the alert settings for the Long Running Query alert type, for the 1-Production Server Group. This database-level alert type will then use these settings for every database in this group.
Configuring alert settings for individual objects
If we need to refine the alerting strategy even further (though be careful with this), we can, for example, configure certain alert types for individual machines, disks, instances, databases, or jobs.
Simply drill down to select the required hierarchical level from the Monitored servers list. The alert types relevant for the selected object are listed. For example, if you select a database, only the database-specific alert types are displayed and if you edit one at this level, the changes will apply only to that database.
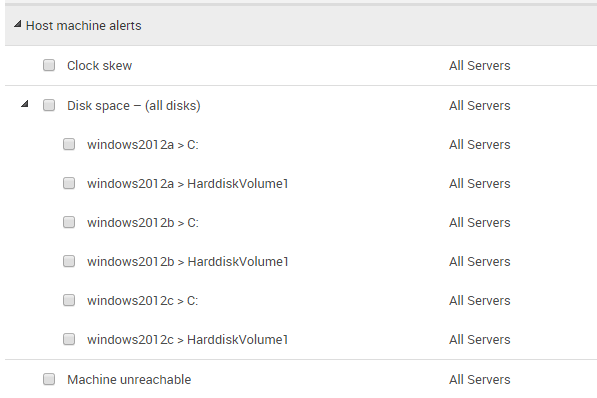
One alert type that users sometimes do need to adjust, on a server-by-server basis, is the the Disk space alert type, which often must be configured according to individual drives on a machine.
Navigate to a particular machine which has more than one disk, and you will see the arrow ![]() next to the alert type. Click on it to display the drives, and select individual or multiple drives for configuration:
next to the alert type. Click on it to display the drives, and select individual or multiple drives for configuration:
Finding customized alerts
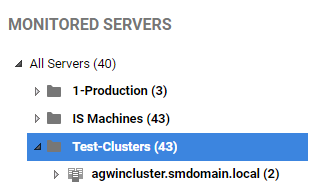
You can see which alerts have been customized at which levels in the Monitored servers list; they are indicated by the number in brackets:
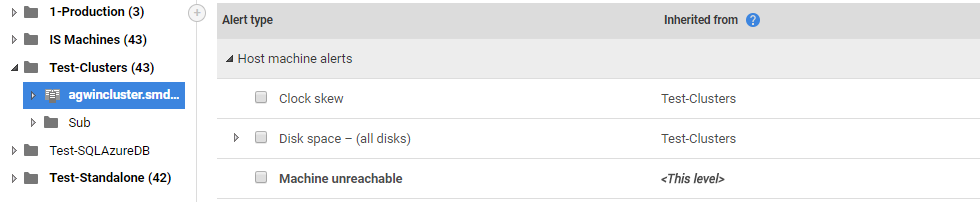
In the above example, two alerts have been customized at the availability group level, and one at the SQL Server instance level. When you select a level in the Monitored servers list, those alerts that have been customized at the selected level are identified by <This level> and highlighted in bold:
This documentation contains proprietary information and is protected by copyright law.
Copyright © 2026 Red Gate Software Limited. All rights reserved


