How Redgate Monitor collects metric and alert data
Published 28 March 2024
Regardless of whether your instances are installed on traditional servers, VMWare or in the cloud, Redgate Monitor will cover all their monitoring requirements for their commercial use and maintenance. Redgate Monitor is used for monitoring SQL Server and PostgreSQL in a wide range of hosting contexts, not just servers hosted on your organization’s network. It will, for example, monitor Azure-hosted SQL Server instances, Azure SQL Databases, and Amazon RDS-hosted SQL Server and PostgreSQL instances. Each of these must be monitored, but they will have different metrics with a different significance.
The object hierarchy for collecting metric and alert data
This diverse collection of different types of host are referred to collectively as monitored objects. Redgate Monitor collects data from these monitored objects in the following hierarchy:
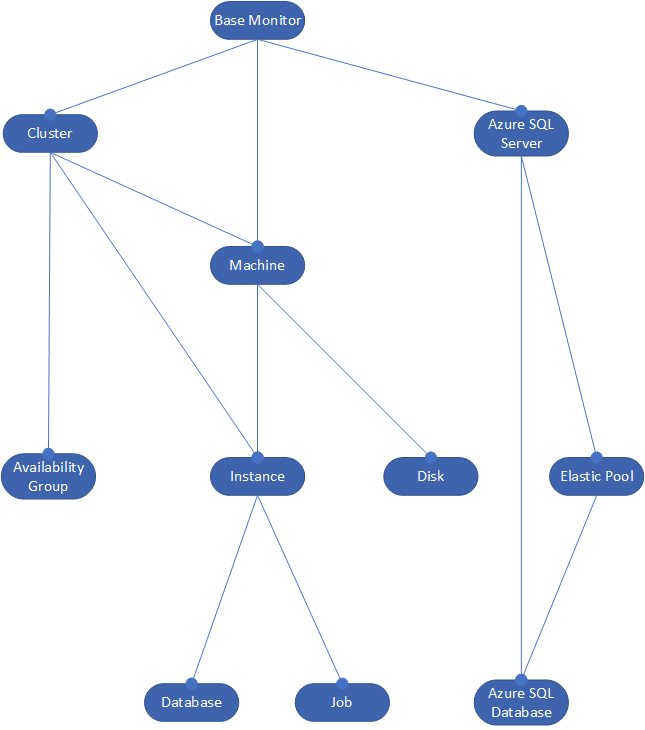
For every monitored server that is registered to a Base Monitor, the latter continuously samples, at preset intervals, a set of built-in metrics (non-configurable) and a set of built-in alerts (configurable) from each of these monitored objects. It captures metrics for every object in the hierarchy: Cluster and Availability Group, Azure SQL Server, including both Azure SQL Database and Elastic Pool, Machine (including VMWare), SQL Server Instance, Database and Job.
Redgate Monitor displays the built-in metrics in various graphs and tables throughout the Web Interface, so that you can understand resource usage patterns on your monitored servers and troubleshoot problems. Redgate Monitor can raise alerts that will warn you of unfavorable conditions or errors on the monitored object, as indicated by the value returned for the alert's associated metric.
You can then configure the settings for the built-in alerts to suit the needs of your servers and applications, such as changing the threshold conditions for the alert to be raised, or completely disabling certain alert types.
Redgate Monitor's "factory settings" for alerts apply at the Base Monitor level, referred to as the all servers level, since they will be applied to all servers registered to that Base Monitor. Every object in the hierarchy inherits the settings for all alert types from the level above it, and you can configure alert settings for relevant alert types at any level in the hierarchy. See: Using the Monitored Servers hierarchy to customize your alerting strategy.
Using Server Groups
To make it as easy as possible to define and apply the monitoring and alerting strategy you need, and to get the most out of Redgate Monitor generally, you should organize your servers into Groups with similar properties and monitoring requirements (See Configuration > Monitoring, Groups ), so that you can adapt your monitoring and alerting strategy to suit the requirements of each group, and also so that Redgate Monitor organizes the monitoring and alert data by these groups, when it's displayed in the UI.
Types of metrics and alerts
Redgate Monitor collects the metric and alert data for each monitored object from a variety of sources, as follows:
WMI and PerfMon counters
(All categories)
Each type of monitored object in the above hierarchy has an associated set of performance objects from which Redgate Monitor collects counters. For example, for each monitored SQL Server instance, there is a set of SqlServer performance objects that capture metric data on resource use (memory, CPU, I/O), user activity (connections, requests, locks, latches), and so on. You can find a full list of the counter metrics here: List of metrics.
Counters are a primary source of metrics and Redgate Monitor stores them and renders them in the various sparkline graphs, tables, and charts in the Web interface, over any time-period that you request. For example:
Server Overview pages – use the plotted metric values to spot bottlenecks in machine resources (CPU, Memory, Disk I/O), and correlate with instance performance metrics, such as average disk read and write times, to understand which resource is limiting performance or throughput.
Analysis graphs – you can plot any scalar metric on a graph, for any monitored server, instance, and database. Redgate Monitor allows for the generation of a baseline of metric, such as I/O or memory requests, so that you can compare time periods quickly and easily and spot anomalies. Doing this often reveals "what changed" when anything untoward subsequently happens that raises an alert.
Estate section – the following pages in the Estate section display aggregate information for scalar metrics.
Disk Usage page, summarizes values from disk-related counters, allowing you to track disk space use across the estate and plan capacity requirements.
Jobs page summarizes metric data collected from job-related counters regarding the success your scheduled SQL Agent jobs
Many counters also raise alerts. For example, the LogicalDisk performance object provides the Disk Used %, and Disk Used Bytes counters are also used to raise the machine-level Disk Space alert type, when used space or free space on a disk volume dips above or below a defined threshold value, for a sustained period.
Query execution statistics and details
(SQL Server, Azure SQL Database, PostgreSQL)
Redgate Monitor collects details for any significant queries running on your SQL Server databases, in order to help users focus tuning efforts on the processes and queries that are primary resource consumers, and the causes of excessive blocking, or even errors such as deadlocks.
Redgate Monitor collects data from various sys.dm_exec_* dynamic management objects to provide details of significant user and system requests that execute on the SQL Server instance over time, their details (SQL Text and execution plan) and their query execution statistics (number of times the query has been executed, and averages for duration, CPU time, I/O activity, and so on). It also captures any significant waits associated with this query (i.e. reasons for any time the query's thread spent waiting, during its execution) from the sys.dm_os_waiting_tasks Dynamic Management View.
All of these details are displayed in the Top queries list on the Server Overview page. Redgate Monitor also retrieves the execution plan for these queries, by getting the plan handle from sys.dm_exec_query_stats.
The total elapsed time for an executing query, taken from sys.dm_exec_requests, is used to raise the Long running query alert on an instance.
Wait statistics
(SQL Server, Azure SQL Database)
To help you understand the primary causes of delays (waits) in processing requests on an instance, Redgate Monitor collects wait statistics from the sys.dm_os_wait_stats dynamic management view to provide details of causes of server waits on the SQL Server instance, over time.
I t presents these Wait statistics in the Top 10 Waits table, and associated Wait graph on the Server Overview page.
Currently there are no built-in alerts based on wait statistics.
Backup statistics and details
(SQL Server)
Redgate Monitor collects details for the database backups taken on an instance. It displays some of these details in the Databases section of the Server overview page for the instance. However, primarily they are analyzed and reported in the Backups page of the Estate section, which summarizes backup history across your monitored servers, and allows you to review quickly how well backup strategy fits with the agree Recovery Point Objectives in your Service Level agreements.
The backup_finish_date metric, from msdb.dbo.backupset, is also used to raise the Backup overdue alert on an instance, when that date is older than the time you specify. There are currently no other alerts based on properties or configuration details.
Server and Service availability
(Cluster, Azure SQL Server, Machine, Instance)
Redgate Monitor uses ping and WMI queries to assess the availability servers and services. It checks the availability of every registered server, whether it can connect to, and collect data from, all of them, the availability of the SQL Server and Agent services, and of the services that run the various installed SQL Server components such as reporting services or analysis services.
Redgate Monitor will raise alerts to warn you immediately of any critical server or service interruptions and the cause.
Server Properties and configuration details
(SQL Server)
From various sources, such as system catalog views, the msdb database, and counters, Redgate Monitor collects a range of properties for each monitored object, such as the number of processor cores and operating system details for a machine, the version and edition of a SQL Server instance, the recovery model of a database, the name of a database file, security configuration details (population of highly-privileged server roles).
Redgate Monitor displays this information in numerous places in the Overviews section. However, primarily, it uses it to document your estate, review which versions and editions of SQL Server are installed on which machines (see Installed Versions page) and so understand its licensing requirements.
Processes and errors
(Machine, SQL Server)
Blocking processes
Redgate Monitor uses metrics from the sys.dm_exec_requests and sys.dm_exec_sessions DMVs to detect when a SQL process is blocking others for a defined threshold period, as determined by the “blocked process threshold” configuration setting. When this threshold is crossed, it collects the blocked process report, from the blocked_process_report event in Extended Events, if available, or the standard SQL Server report otherwise.
All the details of the blocking process, and the report, are available from the blocking processes section of the Server Overviews page, and with the blocking process instance-level alert.
SQL User Processes and System Processes
From sys.sysprocesses, Redgate Monitor provides details of the most expensive SQL and system processes (by CPU). You can find this information on the Server Overview page.
SQL Server Errors
Redgate Monitor captures entries in the SQL Server error log and displays them on the Server Overview page.
For the deadlock error, it raises the Deadlock alert, and retrieves the deadlock graph from Extended Events.
Server Permissions
(SQL Server)
SQL Server logins and roles
Redgate Monitor uses sys.server_principals and sys.server_role_members system catalogue views to sample server logins, server roles and server role memberships. This information can be viewed on the Server Overview page for all users and on the Permissions page in the Enterprise edition.
SQL Server database users and roles
Redgate Monitor uses sys.database_principals and sys.database_role_members system catalogue views to sample database users, database roles and database role memberships. We additionally use sys.database_permissions system catalogue view to verify if a user has connect access. This information is sampled only in the Enterprise edition and can be viewed on the Permissions page.
SQL Server permissions and database permissions
Redgate Monitor uses sys.server_permissions and sys.database_permissions system catalogue views to sample server and database permissions. This information can be viewed on the Permissions page in the Enterprise edition.
Users and groups
Local users and groups
Redgate Monitor uses WMI to query local users and groups information for monitored SQL Servers. This information can be viewed on the Permissions page in the Enterprise edition.
Active Directory
Redgate Monitor uses LDAP queries to access Active Directory information relevant to monitored SQL Servers, including full updates every day (which obtain a copy of all relevant principals from relevant domains), and more regular incremental updates of changed principals (via uSNChanged), allowing it to correlate SQL Server logins against Active Directory users and group hierarchies. This information can be viewed on the Server Overview page for all users and on the Permissions page in the Enterprise edition.
You can configure Redgate Monitor to collect only a subset of your Active Directory information using LDAP filters. Please contact support for further details.


