Top Waits
Published 28 March 2024
SQL Server Waits Statistics provides you with a different perspective on performance problems in SQL Server, seeing the progress of interacting processes in terms of the time they must spend waiting for the resources they need. Every time a request is forced to wait, SQL Server records the length of the wait (wait_time), and the cause of the wait (wait_type), the latter generally indicating the resource on which the request was waiting. As just one example among very many, a request to read a page may experience the PAGEIOLATCH_SH wait type, which is a wait that occurs when SQL Server needs to read a data page from disk into the buffer cache and can't immediately obtain a latch on the buffer page.
Redgate Monitor collects wait statistics from the sys.dm_os_wait_stats dynamic management view to provide details of causes of server waits on the SQL Server instance, over time. It presents this data in the Top waits section, which comprises:
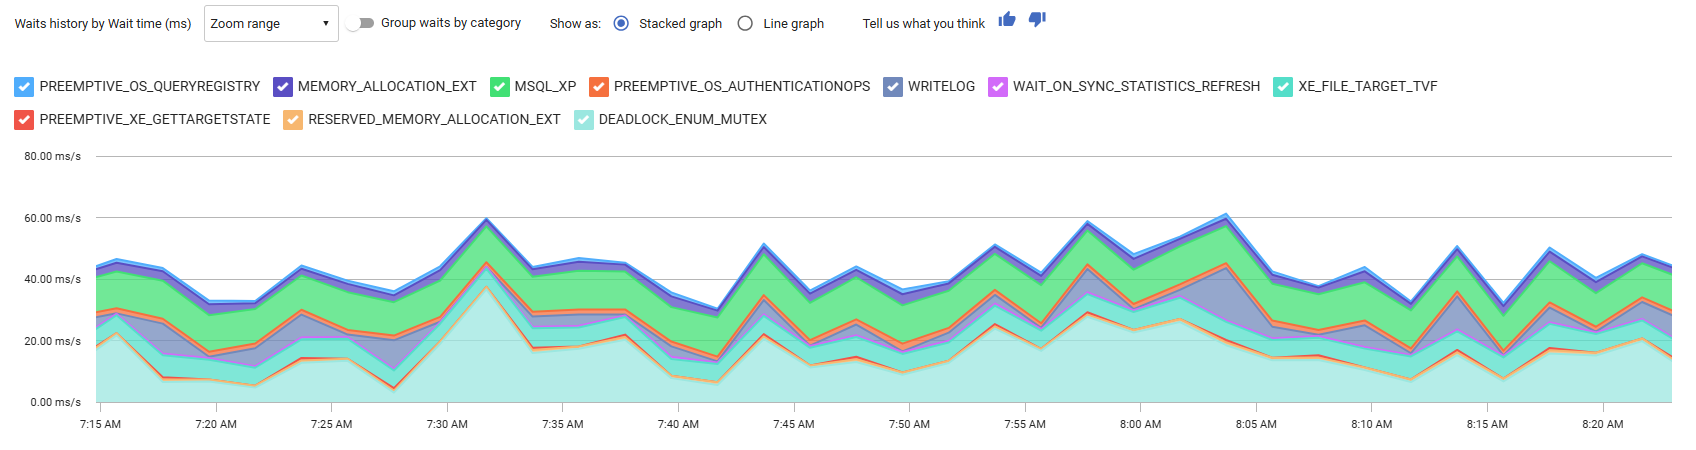
- Waits history graph – frequency or duration (ms) of wait (/s), for each wait type detected over the period of analysis (determined by the focus window on the activity graph).
- Top waits table – where you can see the ten significant wait types, how long SQL Server requests spent waiting for each wait type, and which queries were affected (instance overview only). You can click on any wait type to see a detailed description of the wait type, an explanation of possible possible causes with troubleshooting advice, and details of any queries affected.
To learn more about using wait statistics as a performance diagnostic tool, we strongly recommend the following white paper (PDF format), produced as a collaboration between Redgate and sqlskills.com: SQL Server Performance Tuning Using Wait Statistics.
See the video demo of how to use the Top waits table at Redgate University.
Waits history graph
The waits history graph plots the number of times, or length of time (ms), a thread had to wait (per second), for each wait type detected, over the period. By default it shows Wait time (ms) as the y-axis, but when you click on one of the four columns, in the Top waits table below, it repopulates the table with fresh data, ordered by that column, and the wait history graph y-axis switches to show that column. It's also possible to swap between a stacked or a line graph view, and to group this data by wait category using the group waits by category toggle.
Top waits table
The Top waits table reveals the primary reasons why requests were being forced to wait, and for which resources. The data is read from the SQL Server DMV sys.dm_os_wait_stats.
Like the Top queries table, the Top waits table shows data for the period defined in the focus window of the Activity graph.
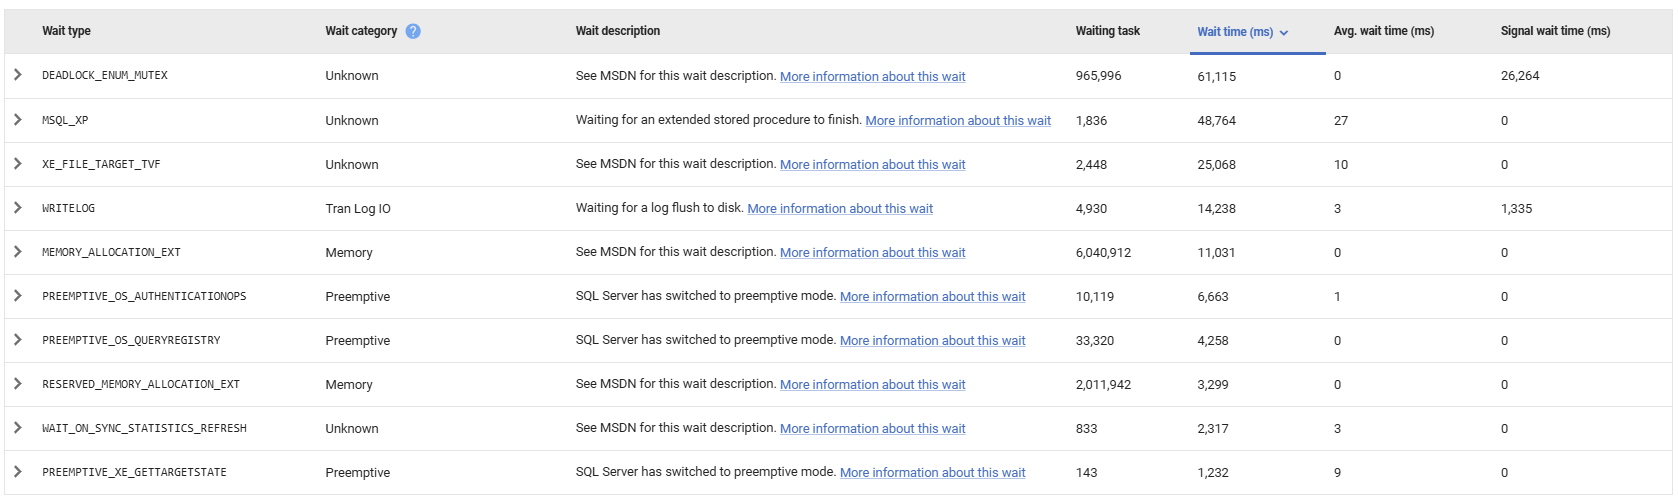
The table shows:
- Wait type – the name of the wait from the list of 600+ described in sys.dm_os_wait_stats (MSDN).
- Wait category - the categorization of the wait according to Microsoft's wait categories mapping table.
- Wait description – a short definition, so you know at a glance what SQL Server is waiting for. Also contains a link to more information about that wait type.
- Waiting tasks – the total number of wait events.
- Wait time (ms) – the total time (in milliseconds) spent waiting for resource to become available. By default, waits are listed in descending order according to this metric.
- Avg. wait time – the total time (in milliseconds) spent waiting for resource, divided by the number of waiting tasks.
- Signal wait time (ms) – the total time (in milliseconds) spent waiting in a runnable state once SQL Server has signalled that resource is available.
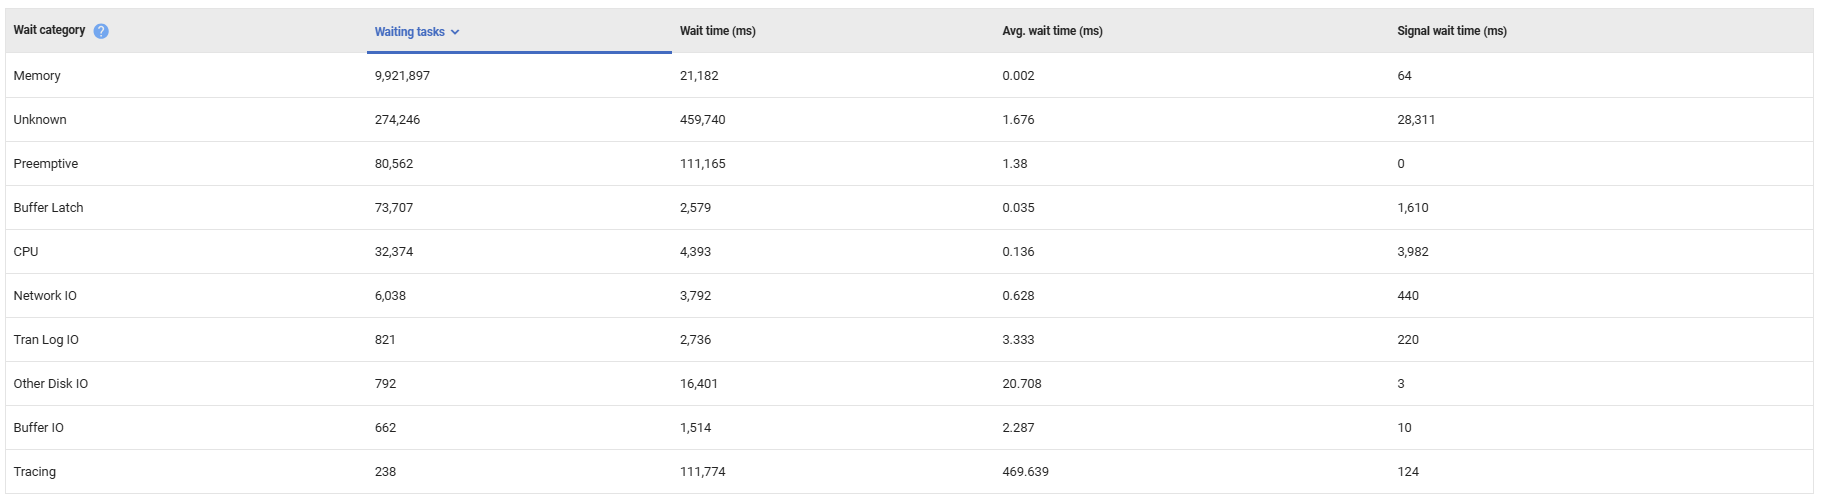
Top wait categories table
The top waits table can be toggled to display the top waits by category. This data is categorized based on information from Microsoft's wait categories mapping table.
The table shows data for the period defined in the focus window of the Activity graph.
Viewing affected queries
Clicking on any wait type row expands it to reveal a list of queries affected by this type of wait, accompanied by query details, plans and query execution statistics, as described for Top Queries.
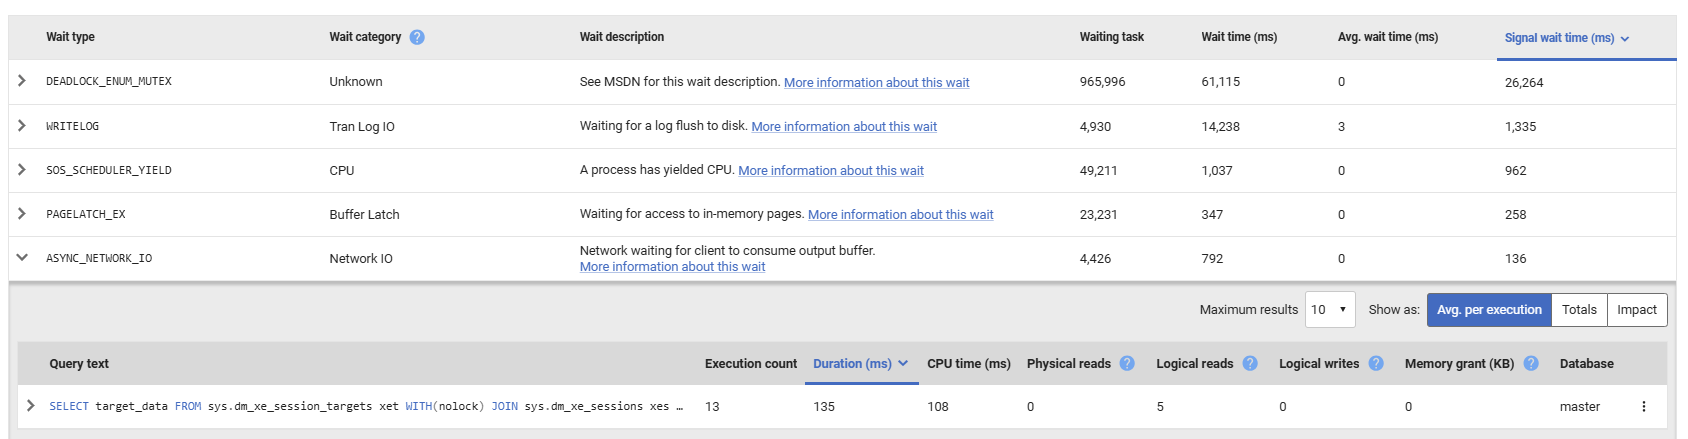
The table contents is effectively to the top queries table. For more details, see: Top queries table.
Click on a query to show the query statement, the latest query plan handle, and a list of other waits that had the greatest impact on the query during execution. See: Viewing query details.
Viewing wait type documentation
Click on the link in a wait's description to show a detailed description of the selected wait type:
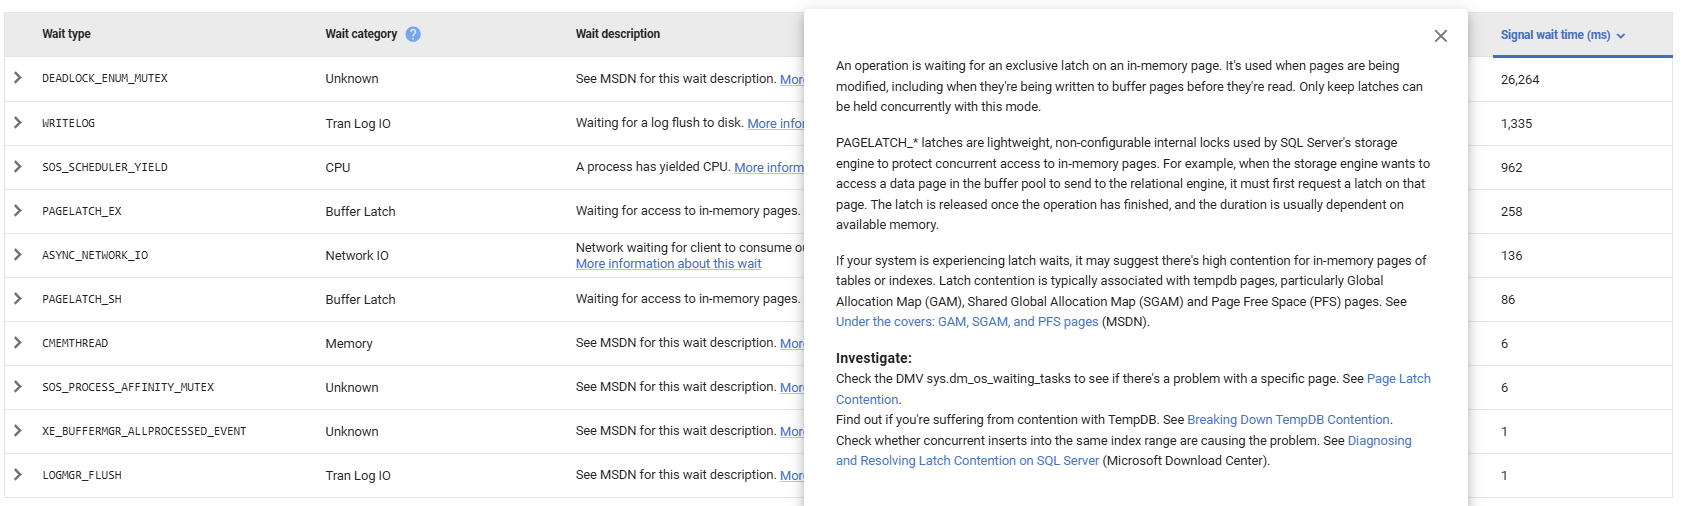
For the most common waits, you can see:
- Details of why this wait occurred.
- Tips on how to start investigating, including links to expert articles, as well as MSDN and TechNet resources.
Next step
This documentation contains proprietary information and is protected by copyright law.
Copyright © 2026 Red Gate Software Limited. All rights reserved


