Top queries
Published 28 March 2024
Redgate Monitor collects data from various sys.dm_exec_* dynamic management objects to provide details of significant user and system requests that execute on the SQL Server instance over time, their details (SQL Text and execution plan) and their query execution statistics (number of times the query has been executed, and averages for duration, CPU time, I/O activity, and so on).
It displays this data in a top x queries table, showing the most expensive queries recorded over the period indicated by the focus window on the interactive timeline with execution statistics and query details. For each query in the list, you can see:
- Query Execution statistics – you can sort the list by Execution count, Duration (ms), CPU time (ms), Physical reads, Logical reads, Logical writes, or Database, which will repopulate the list and sort it by your chosen criteria.
- SQL Text and graphical execution plan – and the plan handle to get it from cache.
- Associated waits – any resources the query had to wait to access.
- Query history graph – shows any changes in plan over the period.
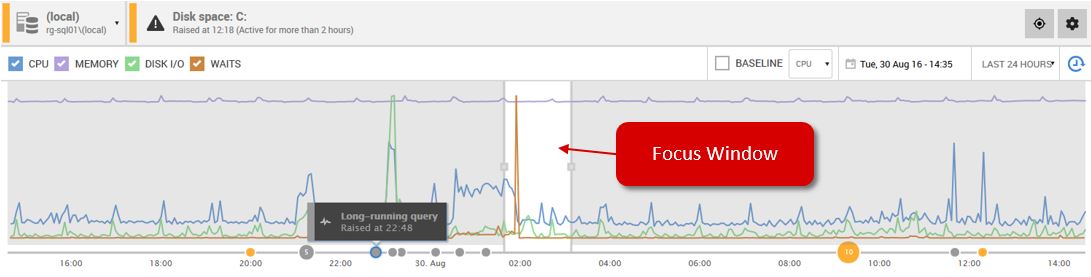
By default, the top queries (and top waits) tables show data for the graph focus window. This means we can correlate what we see in the interactive timeline, with performance statistics and execution details for queries, recorded over the same period, which were the principle resource consumers:
You can also display data from a previous time period of your choice using the Back in Time control. For more details, see: Rewinding time with Back in Time mode.
If data isn't available for the selected time period, it may have already been purged from the Data Repository. See: Why is data missing? below.
Top queries table
See the Expensive Queries video demo of how to use the top queries table, at Redgate University.
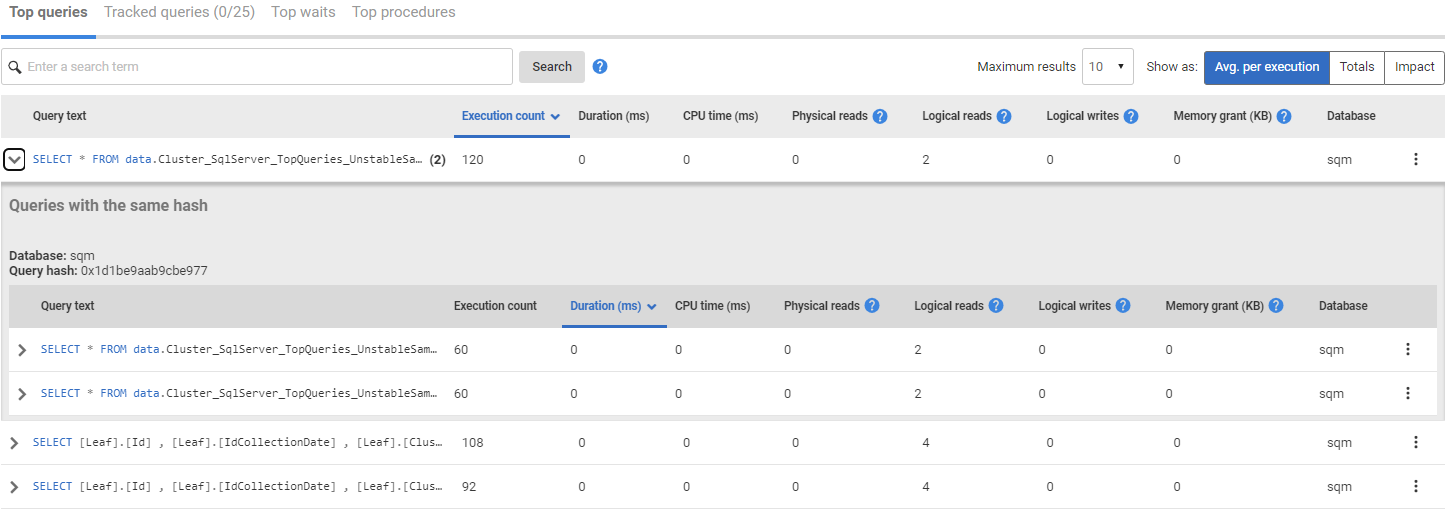
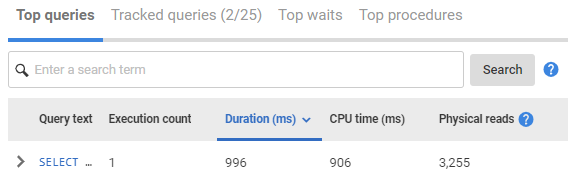
The top queries table shows the queries that used the most resources during the selected time period. The data is updated automatically every 60 seconds. These are collected using SQL handle, statement start and statement end and database to identify a query but we also group these by query hash in the table on a per-database basis. Where queries are grouped by hash we will show a count of how many distinct queries are in the group and display these in the expanded view. This has been done to collect queries together where they only differ by parameter. Queries without a query hash are not grouped.
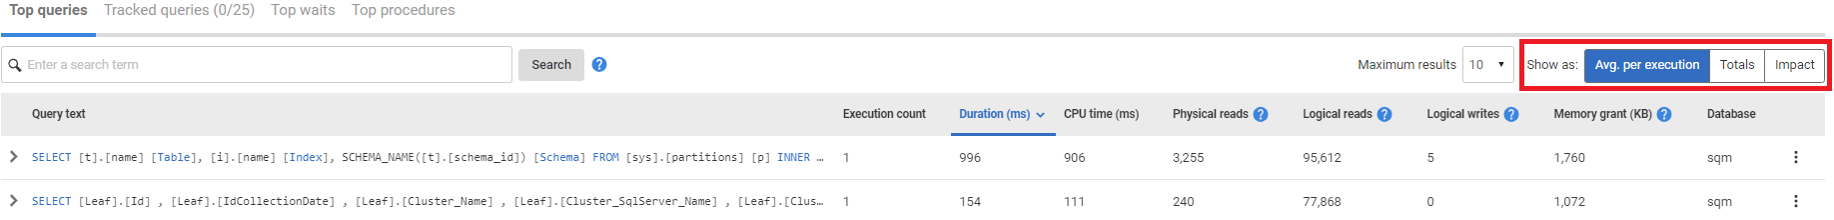
By default, Avg. per execution is selected; this lists queries based on average values over the time period selected. Click Totals to display queries based on total values or Impact to display queries based on query impact:
For Avg. per execution and Totals the table shows:
- Execution count – number of times the query was executed.
- Duration – how long it took (in milliseconds) to execute the query. By default, queries are listed in descending order according to this metric.
- CPU time – how much processor time (in milliseconds) was used to execute the query.
- Physical reads – the number of times a page is read into the buffer cache. If the page is in the cache already, it uses the page already in memory and does not generate a physical read.
- Logical reads – the number of times the database engine requested a page from the buffer cache.
- Logical writes – the number of times data is modified in a page in memory. If a page stays in memory for an extended period, more than one logical write may be required before it is physically written to disk.
- Memory grant (KB) - The memory granted by SQL Server to carry out the query.
- Database – the database the query was run against.
To update the table manually, click on a column header containing numeric data.
Selecting one of these options does not simply change the sort order of the existing list of queries. A new table is generated according to the selected option, so different queries are likely to be displayed.
Click on a query to show the query statement, the latest query plan handle, and a list of waits that had the greatest impact during query execution. See the next section.
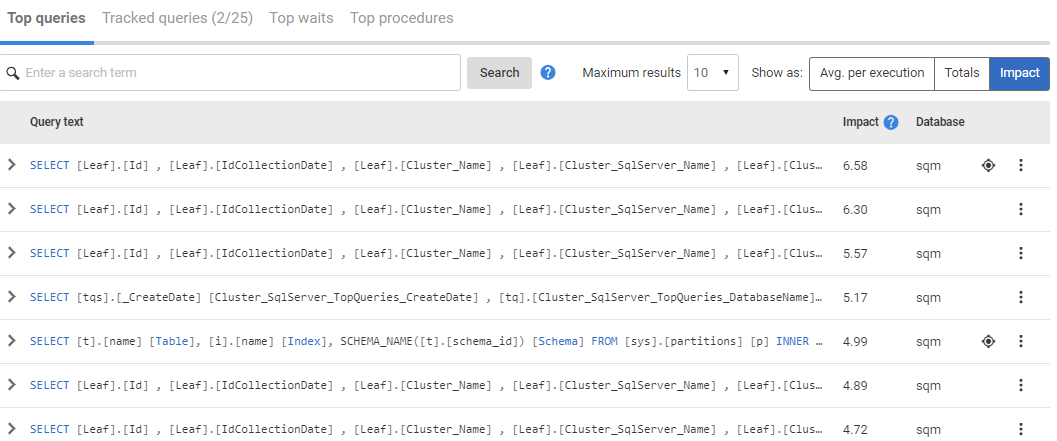
For Impact the table shows:
- Query Impact - a calculated metric representing the overall impact of a query on server.
- Database – the database the query was run against.
The table shows the top queries ordered by impact high to low.
Query impact is a calculated metric which represents the overall impact of the query on the server. This allows you to identify the queries which need most attention.
It is calculated from a combination of metrics as follows:
QueryImpact = log((TotalCPUTime x 3) + TotalLogicalReads + TotalLogicalWrites)
Top query search
The search feature will allow you to search for terms in the query text to narrow down the results you get in the top queries table.
As Redgate Monitor will only sample queries that have met one of its minimum execution conditions you will be unable to locate data for queries below these thresholds even using the search. We would like to hear from you if you identify this as a use case, your feedback can help prioritize further development of this feature.
Advanced Query Syntax
Wild cards
The following wildcard characters can be used in the search term but cannot be specifically matched (e.g. a search containing "select *" would match any query that contains select):
- ? - Matches exactly 1 of any character. (e.g.
?ackcan match back, lack, pack, etc.) - * - Matches 0 or more of any character. (e.g.
*ackcan match back, lack, pack, slack, attack, knickknack, etc.)
Fields
Top queries search supports fielded data. When performing a search you can specify a field or use the default field.
To specify a field you must type the field name (or shortcut) followed by a colon before your search term.
By default top queries search will search the query text fragment so if you do not specify a field to search then the term will searched for within the query text fragment index.
| Search index | Field Name | Shortcuts | Example |
|---|---|---|---|
| Query text fragment (default) | QueryText: | q: , query: | q:myTableName |
| Database names | DatabaseName: | d: , db: , database: | db:myDatabaseName |
| Parent object (e.g. sproc, function, etc.) | ParentObjectName: | p: , parent: , parentobject: | p:myStoredProcedureName |
Phrases
Search terms are usually split into single words. However, if you would like to search for a multiple word phrase then you can put your search phrase in quotes to search for that phrase as a single search term.
e.g. "this is a single search term because it is in quotes"
Separators
Alongside spaces, underscores (_) and periods (.) are considered separators. This means that searching for names of database objects in snake case like p:sp_my_sproc_name may result in unexpected behaviour.
Searching for p:sp_my_sproc_name will return things like sp_my_new_sproc_name, as it contains all 4 terms from the search, regardless of order. The best way around this is to use the aforementioned Phrases feature e.g. p:"sp_my_sproc_name" to find that exact combination of words in that order.
Boolean operators
By default all search terms are joined by an AND logical operator. You can also explicitly add this operators if you wish.
- AND matches where both terms exist
- OR matches terms where at least one term exists
- NOT excludes the term after NOT (can also use - before a term to exclude term)
Grouping
Search terms can be grouped by using brackets. This is most useful when constructing a conditional search.
e.g. (db:tempdb AND "some interesting query text") OR parent:sp1
Limitations on search parameters
The search parameter can only positively identify alphanumeric characters. Other characters will be discarded from the search term.
e.g. for the search select name from customer where id = 1 it will match on id and 1 but will ignore the = character as it is discarded by the query search parser.
Viewing query details
Click on a query to show the Query details page:
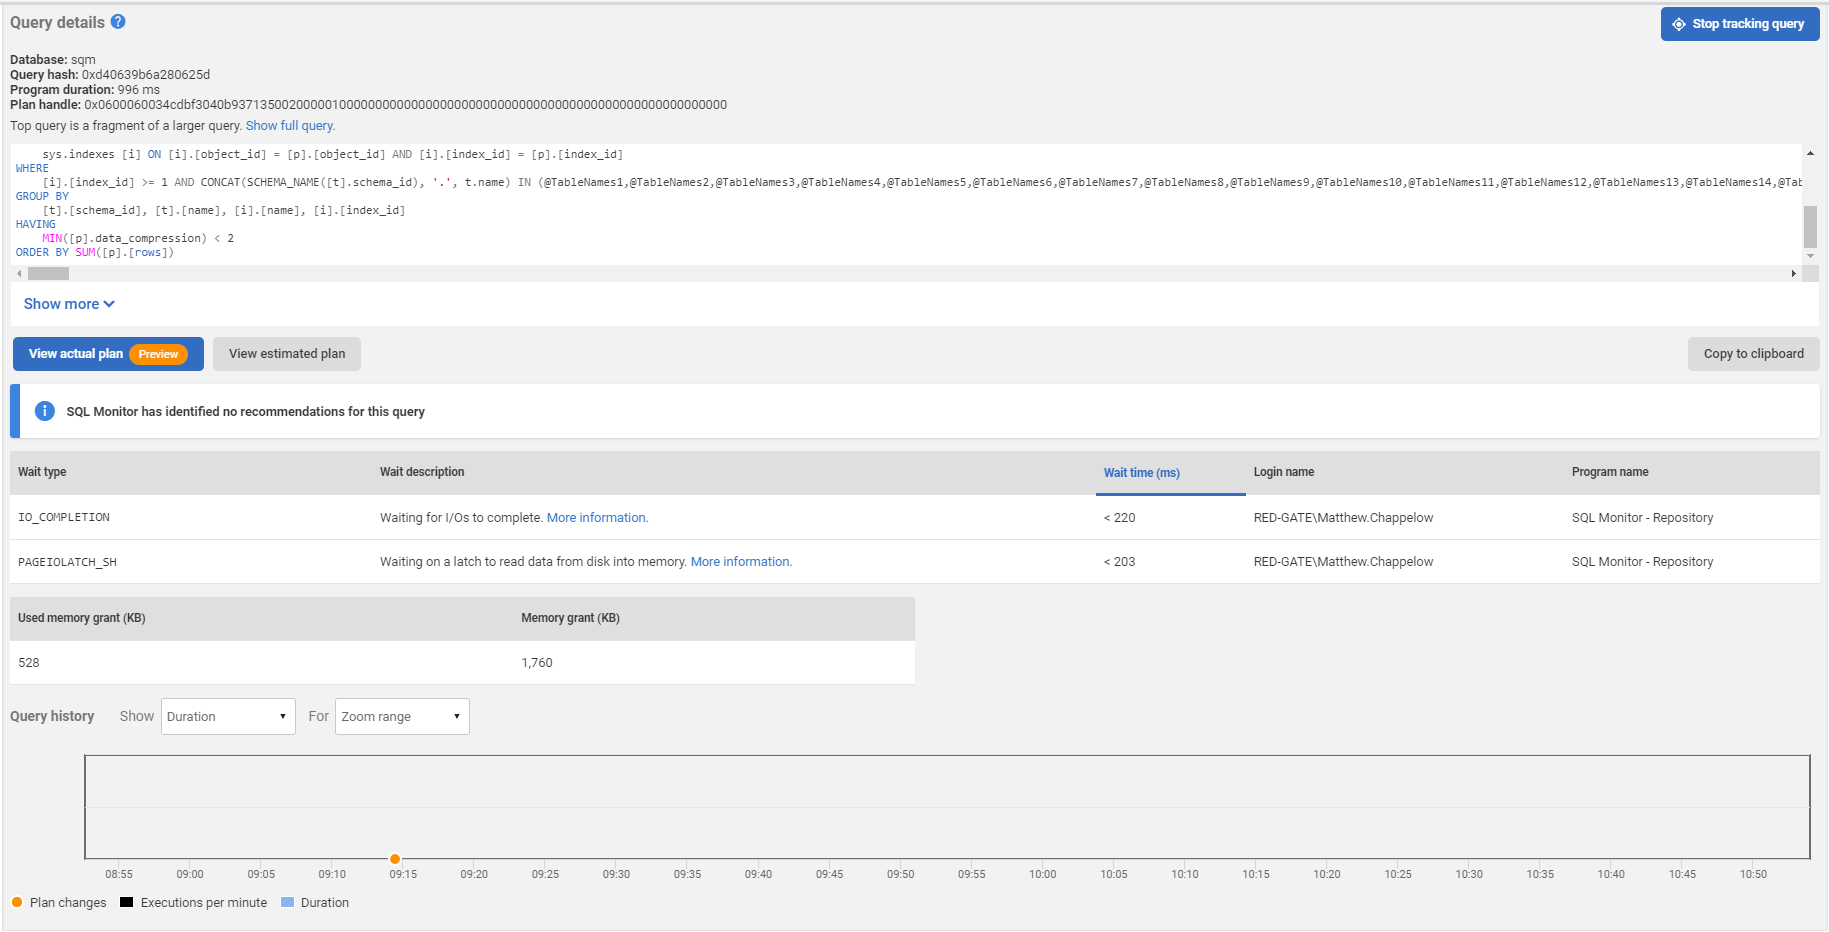
The page shows:
- The latest query plan handle and a button to show the full graphical query plan.
- The name of the database against which the query was run.
- The total query duration – this is the query's average duration multiplied by execution count. The result can be less than the total wait time if the query was processed using multiple threads. This commonly occurs in environments with multiple CPUs, or those using parallel executions.
- The full SQL text of the query.
- Any recommendations Redgate Monitor is able to provide for optimising the performance of the query. See: Query recommendations.
- The waits that occurred during query execution. Click on the link in the wait description to see more information on this wait type. See: Viewing wait documentation.
Redgate Monitor samples the wait time data and returns an approximate value. Hover the mouse pointer over the wait time to display a tooltip containing the margin of error. For example: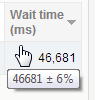
If the margin is between 20% and 40%, the value is preceded by a '~' tilde character: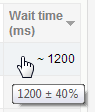
If the margin is between 40% and 100%, the value is preceded by a '<' less than character: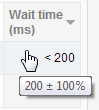
- The query memory grant. - shows the memory grant and used memory grant for the query.
- Query history graph – this data is taken from SQL Server Query Store and highlights changes in query behavior as they relate to changes in execution plan. See Using the Query History graph,
Expanding query details
Click on the ![]() arrow below the query statement. The top half of the page expands and the content changes:
arrow below the query statement. The top half of the page expands and the content changes:
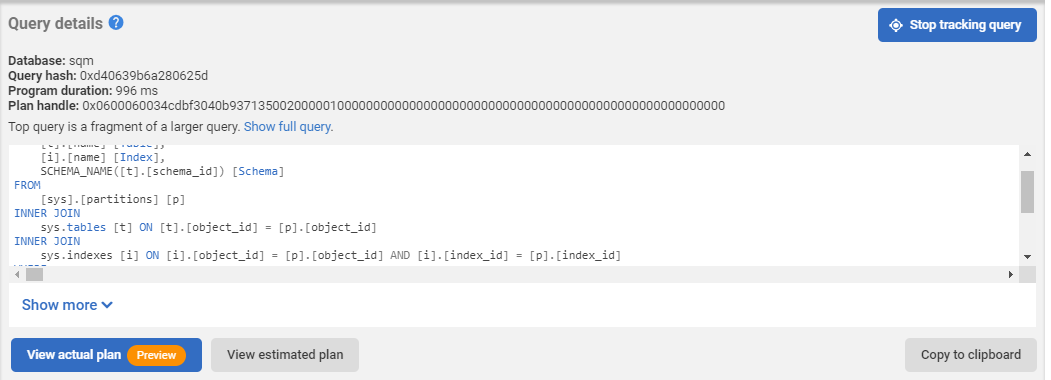
You can now see an expanded query statement that includes the full contents of the batch from which it originates.
The query shown by default is the top query itself, this may be part of a larger query, which you can see by clicking "Show full query".
Viewing the estimated query plan
Click the ![]() button to view the estimated query plan for the associated query. It could also look like this
button to view the estimated query plan for the associated query. It could also look like this ![]() where actual plans are not available.
where actual plans are not available.
This will bring up the query plan explorer:
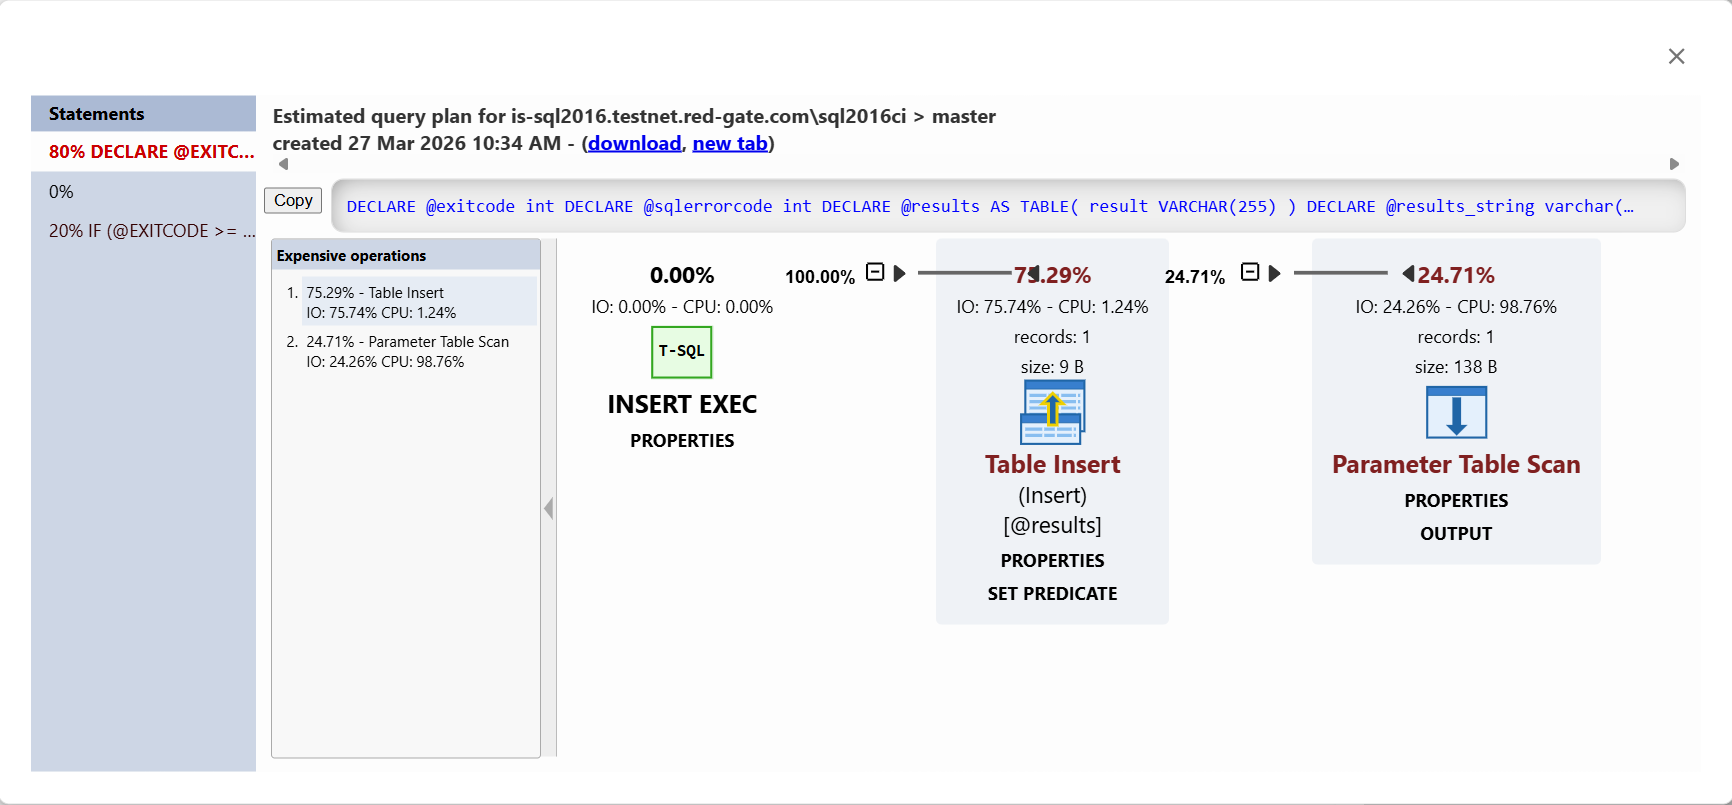
From here, the query plan can be downloaded with the "download" link at the top.
Since version 13.0.30 of Redgate Monitor, it's possible to redact query plan parameters for all users (incl. administrators), by setting the SQLMONITOR_AlwaysRedactQueryPlanParameters environment variable on the Website to true.
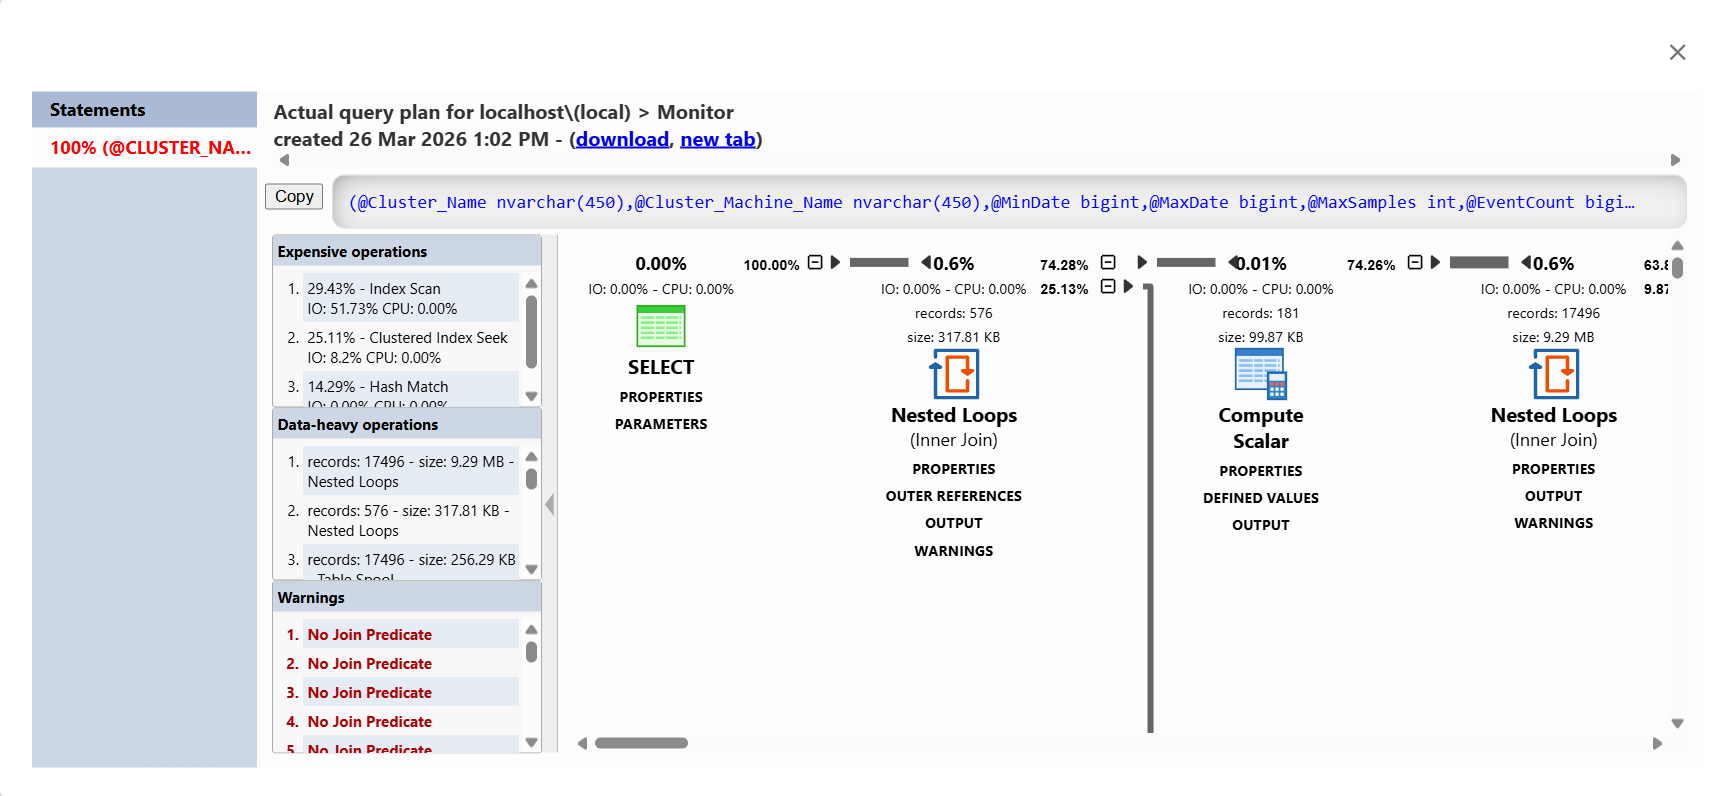
Viewing the actual query plan
If you are on SQL Server 2019 or later and have enabled the recording of actual query plans on the monitored instance, you will be able to click the "View actual plan" button to view the latest plan for the associated query.
Clicking the view actual plan button will bring up the query plan explorer as above but the header will instead look like below:
Collecting actual query plans will increase the network usage on the monitored entity and the amount of disk space Redgate Monitor repository will take up ; so we recommend having a short data retention period for the actual query plans and opting-in to the LAST_QUERY_PLAN_STATS option on the important databases.
Using the Query History graph
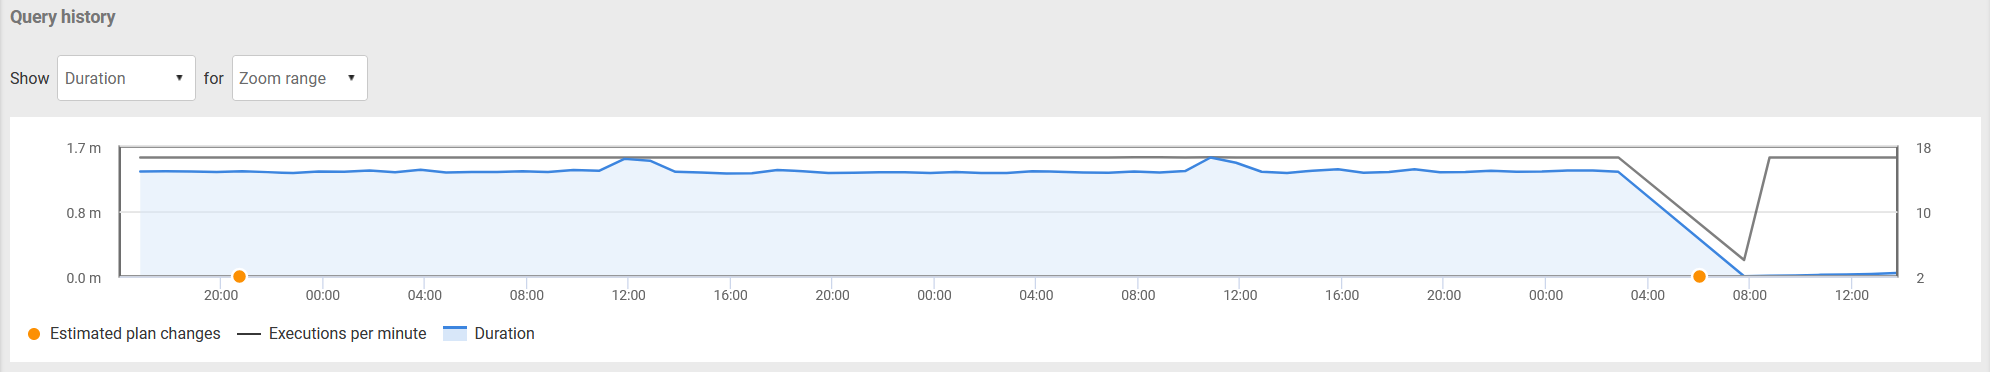
The execution plan change that occurred around 6AM in the above graph, is indicated by the orange Estimated plan changes circle.
Also between 3AM and 8AM, the number of executions of this query, per minute, has fallen from somewhere in the range of 18 every minute to 3. See the exact details by hovering the mouse over the dark line representing Executions per minute, to get a pop-up detailing the information captured:
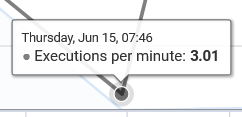
So, instead of 18 executions a minute, we're only getting 3. While the cause might be completely benign, such as that an application simply stopped calling the procedure, it might alternatively be the problem that explains why your boss just showed up in your cube. Let's gather some more metrics so we can give them the story.
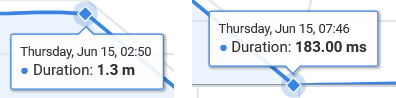
Hover over the Duration line, at a time shortly before and shortly after the change in behavior to show the impact on average query duration. Here, we see an average duration of 1.3m before the change in plan, and afterwards, a consistently shorter duration of about 183 ms:
Click on each of the plan changes to see what plan was implemented at each point. If we choose the second of the two, you will see the plan currently in use (which you can confirm by selecting View estimated plan in the query details).
See the Product Learning Article Why is my query suddenly slow? for further details of this feature and an example.
Estimates vs actuals drift and historical actual plans
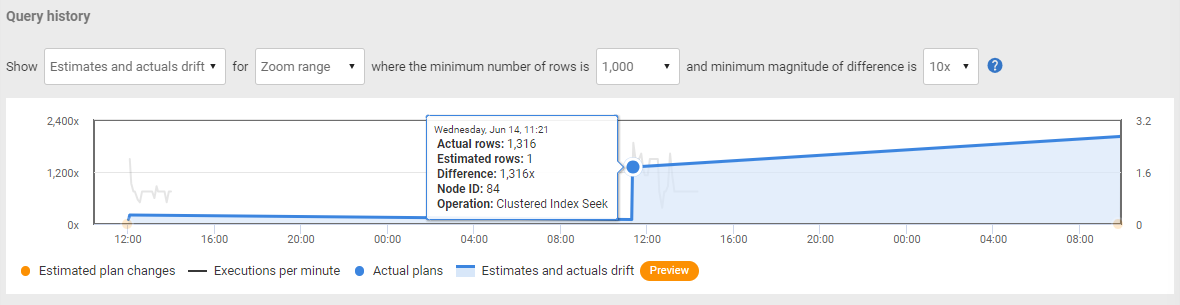
When the collection of actual query plans is enabled, an additional option for the graph the query history will be available via the metric dropdown. This is the estimates and actuals drift, and is the default metric when available.
This graph displays instances where there was significant drift between the estimated and actual rows in the most expensive operation of an actual query plan. Hovering over a point on the blue line of the graph will provide additional information about the plan that was sampled for that point. Clicking on the resulting dot will allow you to view the actual plan for that execution.
Configurable thresholds for what counts as a significant drift are available via dropdowns above the graph. The default values for these are a minimum number of rows of 10 000 and a minimum magnitude of difference (defined by the larger row count divided by the smaller one) of 10 times between the estimated and the actual rows.
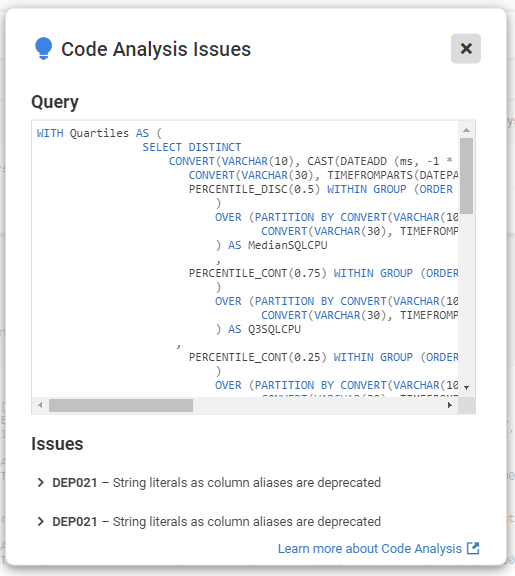
Code analysis
Redgate Monitor identifies deviations from SQL query best practices using the Code Analysis library it shares with SQL Prompt. Addressing these issues will improve the overall quality of the query and can improve execution performance. Learn more about the rules that Redgate Monitor uses in the Code Analysis for SQL Server documentation page.
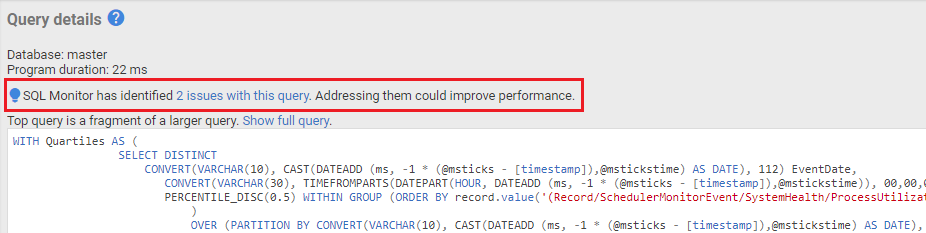
Clicking the link with the number of identified issues opens a window with details:
Why is data missing?
Queries or waits may not be available for the selected time period for any of these reasons:
- There was no significant data to capture.
- The data has been purged.
- Redgate Monitor wasn't running.
- The database was unavailable or suspended.
- Redgate Monitor couldn't sample the data.
See also
The following Product Learning articles will help you understand how to use Redgate Monitor's metrics, alerts and performance diagnostics to investigate query performance problems:
- Troubleshooting a painful query using execution plans in Redgate Monitor
How to use Redgate Monitor to identify an unusual set of behaviors on the server, then narrow down the cause of the behaviors to a particular query. Why is my query suddenly slow?
The performance of a query has suddenly changed, for no obvious reason. With Redgate Monitor, you can study the query history, get the "before" and "after" plans, diagnose the cause.Investigating problems with ad hoc queries using Redgate Monitor
Phil Factor demonstrates the performance problems that overuse of ad hoc queries can cause and then how Redgate Monitor can warn us when they are the cause of these problems on your SQL Servers, using built-in metrics such as SQL Compilations/sec metric and Batch Requests/sec.
Next step
This documentation contains proprietary information and is protected by copyright law.
Copyright © 2026 Red Gate Software Limited. All rights reserved


