Add Amazon RDS SQL Server
Published 07 October 2020
Amazon RDS provides cloud-managed SQL Server instances. Each instance will run on its own isolated database environment operating within Amazon Web Services (AWS). When dealing with a cloud server, it's not possible to retrieve metrics in the same way as on-premise servers, meaning that SQL Monitor relies on the AWS API to retrieve some metrics. Further metrics are only available when the Enhanced Monitoring feature is enabled for the Amazon RDS instance. This page explains how to add an Amazon RDS SQL Server to SQL Monitor, including details of how to set up an AWS API user, and supply its credentials to SQL Monitor.
For details of the metrics and alerts available for Amazon RDS SQL Servers, which of these are available only through the AWS API, and which also require the enhanced monitoring feature to be enabled for the RDS instance, please see: Amazon RDS metrics and alerts.
- Go to the Configuration tab and under Monitoring, select Monitored servers.
- Click the Add Amazon RDS SQL Server button. You will be redirected to the Add Amazon RDS SQL Server page:
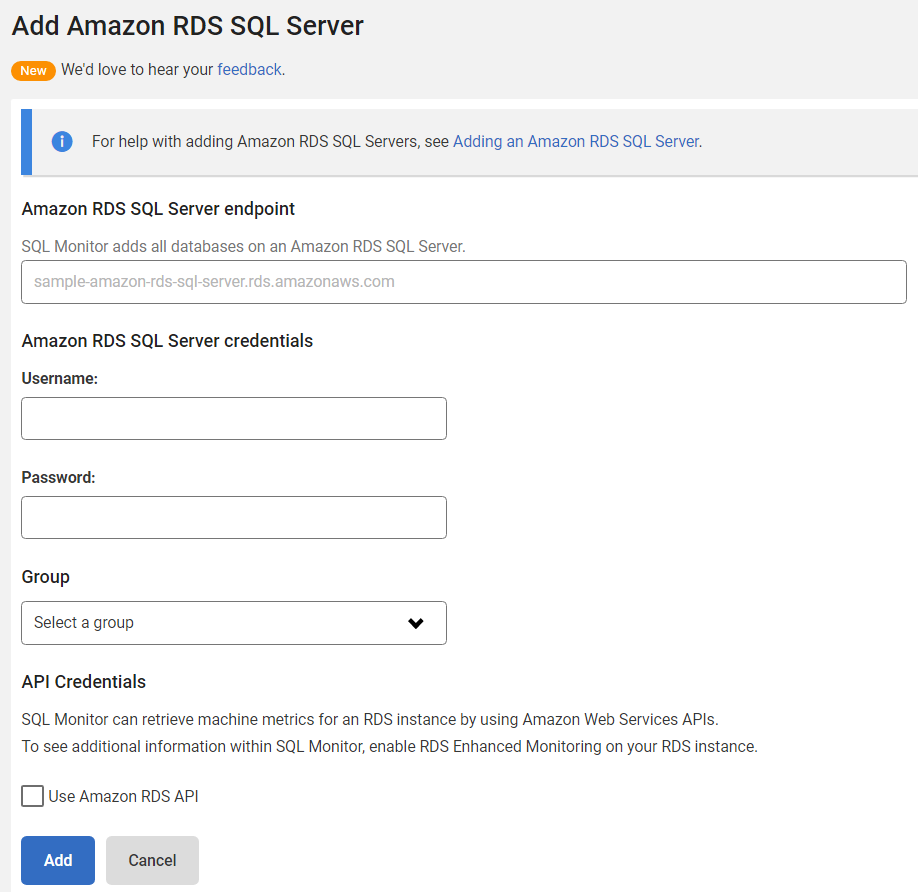
- In the Amazon RDS SQL Server endpoint field, enter the endpoint for the RDS instance provided by AWS, this will end with ".rds.amazonaws.com".
- In the username and password fields, enter the credentials for accessing the Amazon RDS SQL Server instance.
- You can select a group where the instance will be added, select "Uncategorized" if you don't want to put it in any particular group.
- For capturing machine metrics for your Amazon RDS SQL Server instance, you must mark the Use Amazon RDS API credentials checkbox and provide API Credentials information.
AWS API credentials
Most of the machine metrics can only be obtained through Amazon AWS API.
Some machine metrics are only available through the Enhanced monitoring feature of Amazon RDS, such as disk capacity and memory performance. If you want the full monitoring experience for machine metrics you should enable the enhanced monitoring in your Amazon RDS SQL Server instances. Be aware that enhanced monitoring might incur extra charges, check the RDS Enhanced Monitoring documentation for more information.
Creating an AWS API user
Here is some information about how to create the AWS API user. For full guidance, please consult the Amazon AWS IAM documentation.
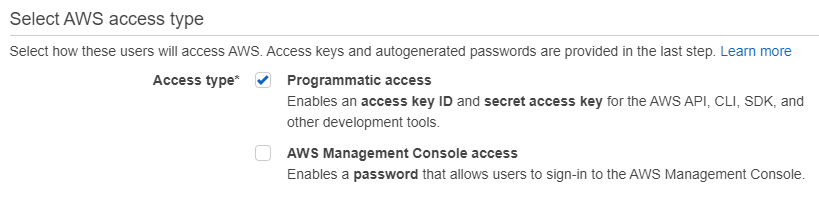
- When creating your IAM, make sure you mark the Programmatic access option. This will generate the credentials used by SQL Monitor.
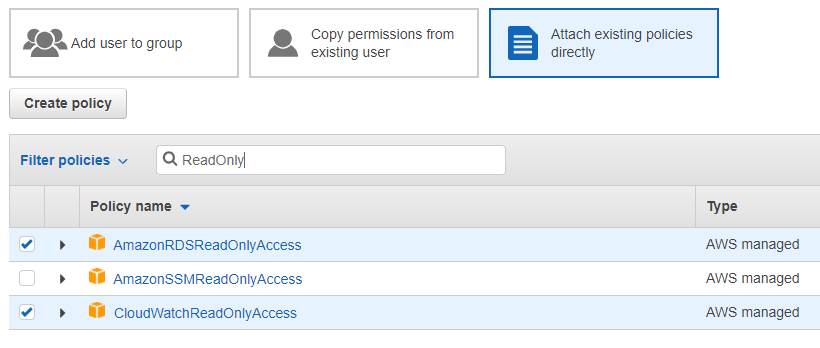
- When setting the permissions, select Attach existing policies directly and select the policies AmazonRDSReadOnlyAccess and CloudWatchReadOnlyAccess.
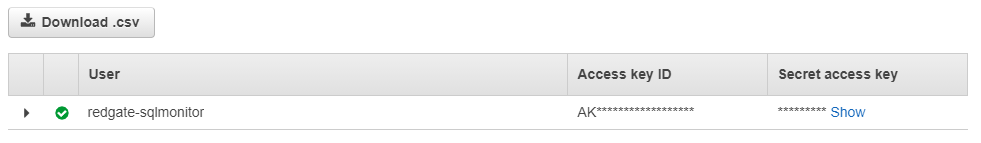
- At the end of the process, you'll get access to the Access key ID and Secret access key. Make sure you save them to enter them later in SQL Monitor.
Using AWS API credentials in SQL Monitor
- Mark the option Use Amazon RDS API.
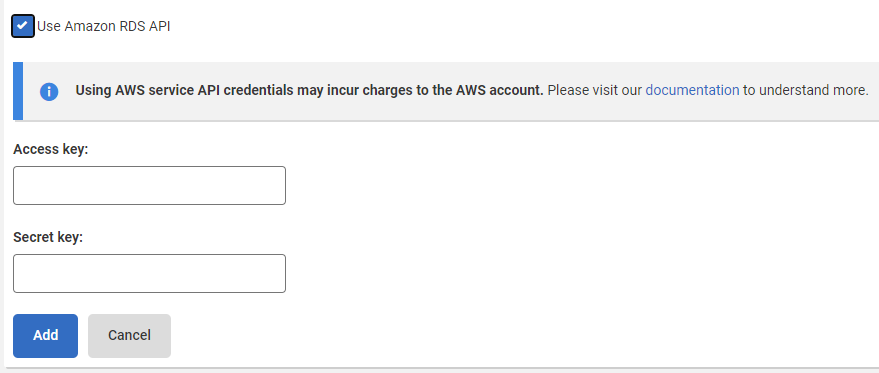
- Enter the access and secret key for the AWS user with programmatic access.
AWS API usage and charges
Here's the list of AWS API endpoints used by SQL Monitor:
| AWS Product | API Action | Usage (per RDS instance monitored) | Requires enhanced monitoring? |
|---|---|---|---|
| CloudWatch | GetMetricData | 5 metrics retrieved in a single request per minute | No |
| CloudWatch Logs | GetLogEvents | 1 request per minute | Yes |
You can check the Amazon CloudWatch pricing page to see how much the requests would cost for the region where your RDS instances are located.
Amazon AWS might charge for storing CloudWatch logs and for data transfer, these charges are not covered here as it might change depending on your CloudWatch configuration for keeping historic data and the data transfer charges will depend on whether your Base Monitor or SQL Monitor installation will be hosted in AWS EC2 and if it will be within the same region of the monitored RDS instances.
Example scenario
Consider 5 Amazon RDS SQL Server instances being monitored 24x7 for a period of 30 days.
This is just an example to demonstrate how you can get an estimation of your requests charges, refer to the AWS documentation to get real up-to-date values.
GetMetricData
Calculating the total amount of GetMetricData requests for the given estate size for 30 days:
5 RDS instances * 1,440 minutes per day * 30 days = 216,000 GetMetricData requests
In this example, we'll consider that the GetMetricData is billed $0.00001 per metric requested, i.e. $0.01 per 1,000 metrics requested (price for US East region at the time of this writing).
5 metrics requested * $0.00001 per metric = $0.00005 per GetMetricData request
We then have the price for GetMetricData requests:
216,000 GetMetricData requests * $0.00005 per GetMetricData request = $10.8
GetLogEvents
As part of this example, requests to GetLogEvents API endpoint are not charged by AWS, so:
5 RDS instances * 0 billable request per minute * 1,440 minutes per day * 30 days = 0 billable requests
The total estimate price of AWS API requests would be $10.8
This documentation contains proprietary information and is protected by copyright law.
Copyright © 2026 Red Gate Software Limited. All rights reserved


