Current activity
Published 16 November 2021
SQL Monitor shows you which queries are running on your instance in the current activity tab.
This allows you to inspect your server activity in real time, giving you the ability to identify a problem query while it's still running or simply be able to react even before the query finishes.
Refreshing the page
SQL Monitor will collect the data when the current activity page loads. The exact time of the collection is shown on the page, under the tabs.

By default, the data on the page does not refresh. If you wish to refresh the data, you can do so in the following ways.
- Manual Refresh. This can be done by pressing the Refresh button. This is good for monitoring short queries you are triggering yourself.
- Auto-refresh. By using the Play/Pause button, you can enable Auto-Refresh. This is good for continuous, hands-off monitoring.
- Reloading the page via the browser. This is not recommended, as it is slower than the alternatives.
Auto-refresh

Auto-refresh can be started and stopped using the Play/Pause button. This will start a timer which will refresh the page data when elapsed.
The interval of the timer can be changed using the dropdown next to the Play/Pause. The selected interval is indicated by a check. Changing the interval will also un-pause the timer.
Auto-refresh is temporarily disabled when you open a row to inspect a query.
Filters
Filters are available to make it easier to find a particular query. Provided filters are against status, blocking status, elapsed time, login, program and database.
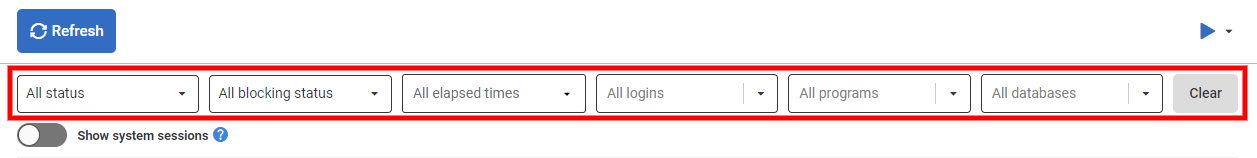
Along with the filters, a toggle is provided to include system sessions.
Query Details
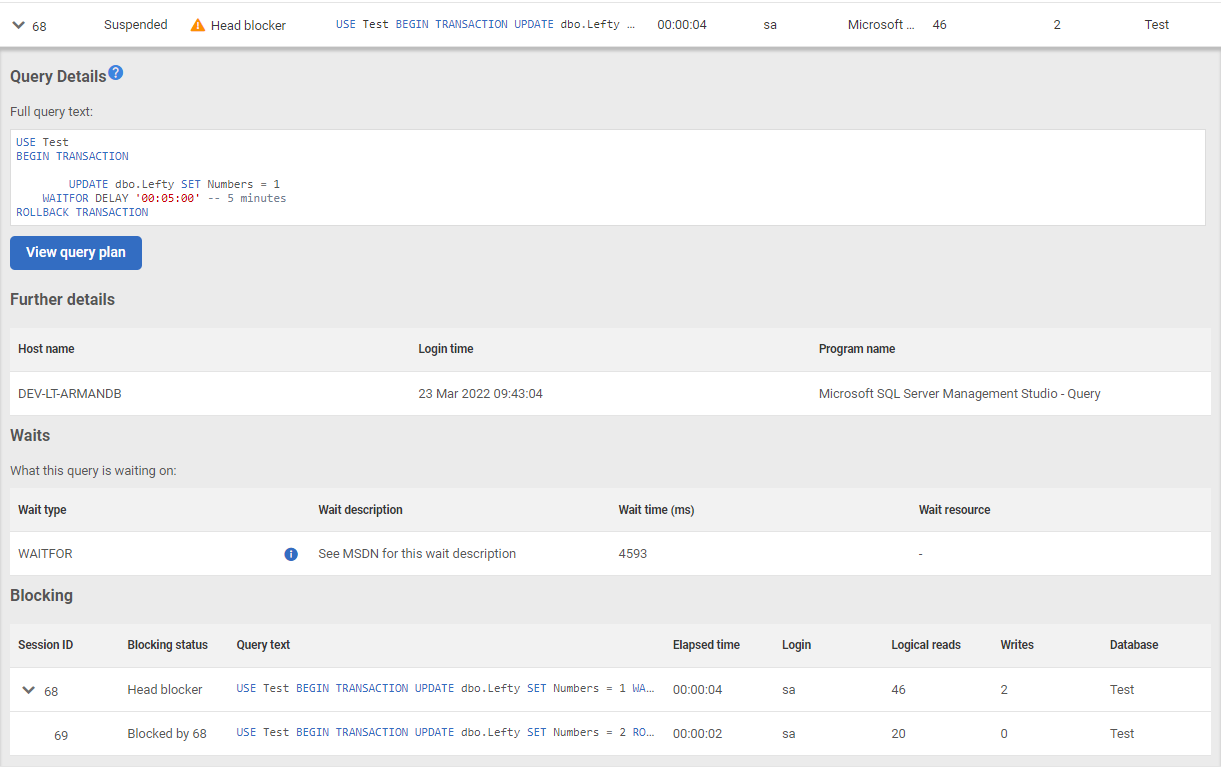
The table shows you the query text, session id for the query and some execution statistics.
You can expand the row to show the Query Details. This includes extra detail for the previous statistics, blocking and waits information, and a button to view the query plan.
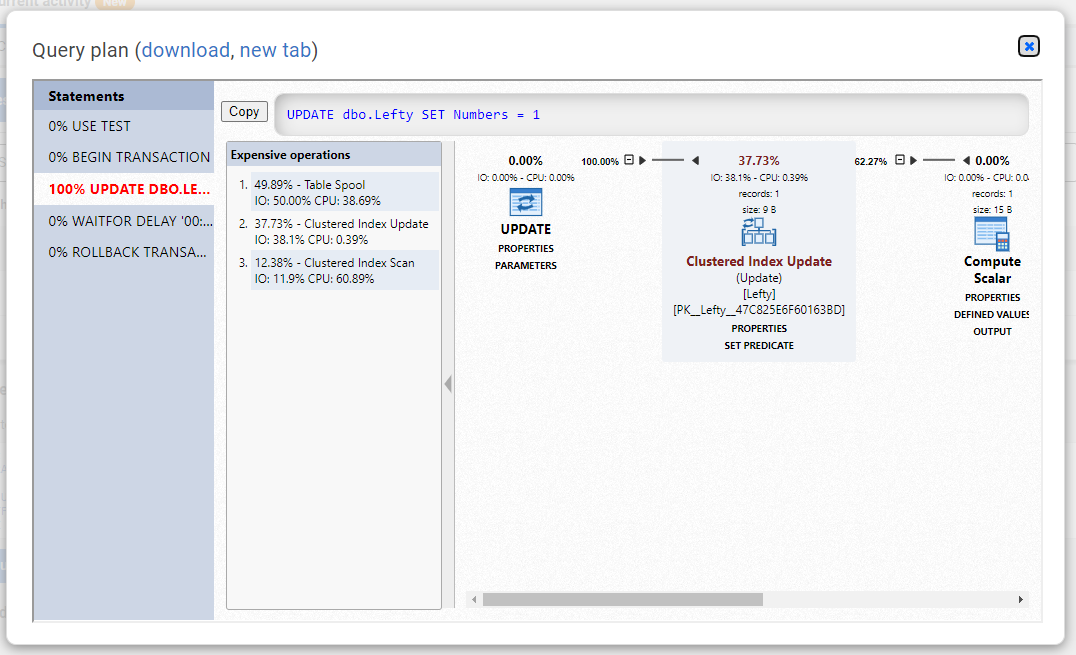
The View query plan button allows you to view the query plan in the browser and download it if you so chose.
On the main table you can identify the head blocker immediately with the blocking status column and expand the row to see the full blocking tree in the blocking section.
The data shown on the table are collected from sys.dm_exec_sessions and sys.dm_exec_requests dynamic management objects. Unlike other sections, it is displayed without being saved to SQL Monitor Repository, this means once the page is reloaded you will lose the data shown on the page.
This documentation contains proprietary information and is protected by copyright law.
Copyright © 2026 Red Gate Software Limited. All rights reserved


