Using SQL Monitor for the first time
Published 28 October 2013
After you've installed SQL Monitor for the first time
When installation is complete, click Finish to launch SQL Monitor in your web browser.
If SQL Monitor is installed locally, you can also launch it by selecting Red Gate > SQL Monitor from the Start menu, or entering the URL http://<webserver>:<portnumber> (eg http://mymachine:8080). If SQL Monitor is installed on a different domain or subdomain, use the fully-qualified machine name: http://<webserver>.<domain>.com:<portnumber>.- Create an Administrator password to log in to SQL Monitor:
If you don't see the Create password page when you enter the URL for SQL Monitor, check the details for the Base Monitor machine and port number are correct and that the Base Monitor service is running.
The password you enter automatically creates the Administrator user role. Share this password with other users who require access to every SQL Monitor feature. You can change the Administrator password or create Standard and Read-only user roles using the Manage user roles page (Configuration > Manage user roles). See Managing user roles. - Select the servers you want to monitor.
Click the Monitored Servers link in the message box, or select Manage monitored servers from the left side.
You need to supply credentials for SQL Monitor to connect to both the host machine and SQL Server instance. Click any
 icon for more information about the format for entering a server name and the credentials required.
See Adding servers to monitor. - Check that SQL Monitor can connect to the servers using the supplied credentials.
The status of each server you add is shown in the Status column. When SQL Monitor is successfully monitoring the following is displayed:

If there is a problem collecting data from a server, click Show log:

Review the error message, and if required, edit the credentials, or take other remedial action. See Account permissions required.
- Go to the Global Overview page to see the current health of your monitored servers and databases.
Click the Overviews tab. All your monitored servers should be displayed, showing performance data and any raised alerts. You can start to drill down by selecting particular instances or databases from the Monitored servers list on the left side. See Working with overviews.
After you've been using SQL Monitor for a short while
- If required, organize your monitored servers into groups. This will help you manage your development or production servers more easily in SQL Monitor.
- Review any raised alerts.
You may see some alerts already raised for your servers. SQL Monitor is pre-configured with default settings for all alert types.
To review any raised alerts, go to the Alerts tab and click on an alert in the inbox to view its details. You can then start to clear alerts that you have dealt with, or configure their settings. See Working with alerts. - Review the default settings for all alerts.
Click the Configure alerts link under Monitored servers on an overview or alert page to view all the alerts that SQL Monitor can raise, and review their default settings. You can configure an alert's settings globally (at the All Servers level) or for any group, server, database or job. See Configuring alerts.
- Set up email notification for your alerts.
Go to the Email settings page (Configuration > Email settings), and enter your SMTP mail server settings and a global email address. SQL Monitor will send emails to this email address when alerts are raised. You can later configure each type of alert to send emails to different recipients. See Setting up email notification.
After you've run SQL Monitor overnight
- Set up a filter to see only important alerts raised since you were last at your computer.
In the Alert Inbox click to expand the Advanced filter panel, and select a time from the From the last box, or enter a custom time range. You can also filter to show only alerts raised at a certain level. Click Save as custom filter to re-apply the filter options quickly every morning:
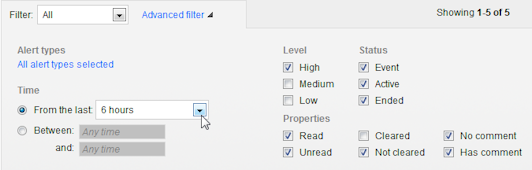
You can save any number of useful filters to help you prioritize reading alerts in the Alert Inbox.
- Rewind time to look at the performance of your servers at a point during the night.
Go to the Global Overview page, drill down to a SQL Server instance or database, then click the Rewind time button in the top right corner:

Select a time and click Apply. All the sparkline graphs are updated to show their value at the time you select. Use the Back in Time bar to step forward or backward to see how these values change over time:

- Go to the Analysis tab to view graphs of various performance metric values for the last few hours for your key servers.
See Working with analysis data.
When you've been running SQL Monitor for several days
- Review the data purging options.
As SQL Monitor collects monitoring data from your servers, the size of the SQL Monitor Data Repository will increase. You can adjust how much historical data SQL Monitor stores in this database, to manage its size and ensure that you don't run out of disk space.
See Purging SQL Monitor data. - Continue to tweak the configuration of alerts as they are raised.
Over time you can improve the relevance of the information SQL Monitor provides by customizing more alerts, at a more granular level. When an alert is raised, open it and click the Customize alert link to edit the settings for only the relevant object, e.g. a specific server, database or job.
- Set up different email recipients for different types of alerts or servers.
As part of each alert's configuration, you can enter a different email address, so that other colleagues in your organization are notified when a particular type of problem occurs, or a specific database is affected. See Configuring email notification settings.
- Compare the performance of various aspects of your server or database performance on different days.
Go to the Analysis tab and select the performance metric and server or database you are interested in. You can now click Compare to compare the performance of a metric to a previous point in time.
To change the time ranges you are comparing, use the Compare with drop-down menu, date/time pickers and paging buttons: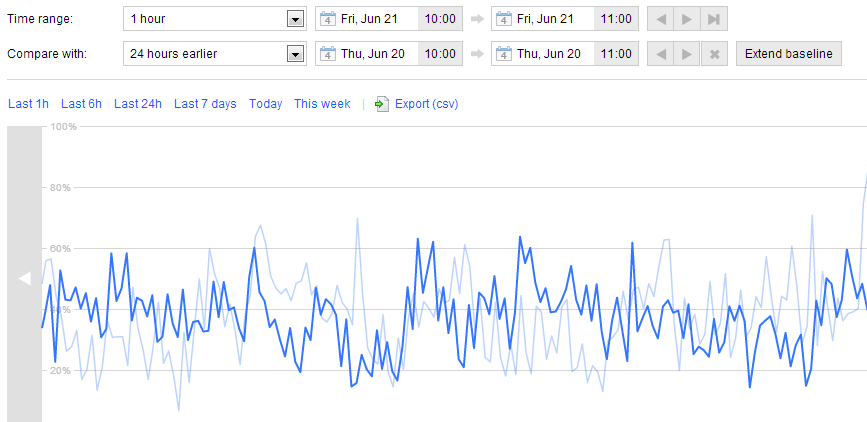
- Identify PerfMon, SQL Server or operating system metrics that you'd like to see on the Analysis tab, and create custom metrics for them. You can also add a custom alert to a custom metric. See Creating custom metrics and alerts. If you don't want to create your own custom metric from scratch, try Using the SQL Monitor metrics website.
- When your evaluation period expires, go to the Licensing page (Configuration > Licensing) to enter your serial numbers and choose which servers you want to license.
- Go to the Monitored servers page to remove any servers you are no longer monitoring.
This documentation contains proprietary information and is protected by copyright law.
Copyright © 2026 Red Gate Software Limited. All rights reserved


