Rewinding time with Back in Time mode
Published 28 October 2013
You can use the Rewind time control in SQL Monitor to enter Back in Time mode, so you can see the state of the data displayed on the overview pages at some time in the past.
You can also step forwards or backwards in time to see how the values on the overview page change. This helps you to investigate the performance of servers around the time a problem occurred. If you know the server or database where there was a performance issue in the past, you should first drill down from the Global Overview page to the relevant overview page.
The amount of previous data available to you depends on your purge settings. See Purging SQL Monitor data.
To enter Back in Time mode
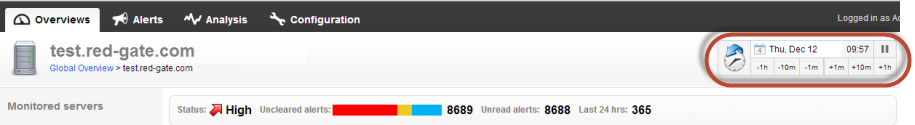
The Rewind time control is displayed in the fixed header at the top of each overview page:
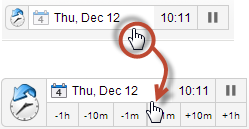
A collapsed version of the control is displayed when you scroll down the page, so it's always easy to access. Move the mouse pointer over the control to expand it:
Use the buttons to go backwards and then forwards in time in one hour, ten minute or one minute increments. If you want to go further back in time to a previous day, week or month:
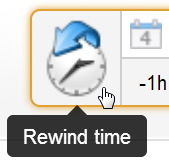
- Click the Rewind time button:
- The date picker is displayed with today's date selected:
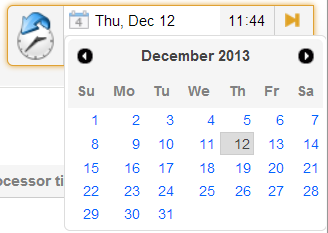
- Select the date, then select the time and type the hour and minute you want to rewind to.
The page is refreshed to show a frozen snapshot of data for the date and time you specified. Automatic data updates to the overview pages are paused, so the data won't change while you're analyzing it. You can still use the buttons on the Rewind time control to go backwards or forwards in time in one hour, ten minute or one minute increments. - While you are in Back in Time mode, you can continue navigating through the overview pages as usual. The time remains frozen until you return to the present. For example, you can first investigate the performance of the host machine, drill down to a SQL Server instance and then to a particular database, all frozen at the same time.
- To return to normal operation, click the
 Return to present button:
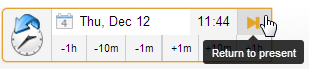
What is displayed in Back in Time mode?
- Performance metrics on the overview pages reflect the time entered in Back in Time mode; the sparkline graph shows the trend for 5 minutes leading up to this time. Click on a sparkline graph to go the Analysis page showing a performance graph of that metric for the ten minute period before the 'frozen' time.
- Processes and error log entries reflect the time entered.
- Top 10 waits and Top 10 queries data reflect the date and time entered, and the time period selected for performance diagnostic data will also apply. For example, if you rewind time by one week and then select 3 days from the drop-down, you'll be looking at data collected between seven and ten days ago.
- Database availability is shown for the time entered in Back in Time mode.
Data not available in Back in Time mode
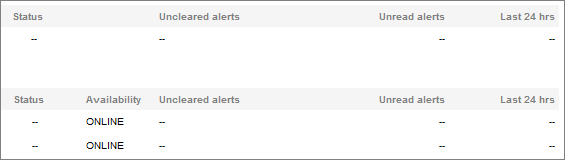
Alert summary information on the overview pages is not shown when in Back in Time mode:
- The alert summary panel at the top of the overview page is removed.
- A dash -- is shown in place of the numbers in the Uncleared alerts, Unread alerts and Last 24 hrs columns. If you click the dash, the Alert Inbox will show these alerts for the current time, not the time in the past.
- The Status column shows a dash (as the Status is determined by uncleared alerts).
What happens when I go back in time before a server was added?
Servers added recently that were not being monitored at the time you are viewing are removed from the Monitored servers list.
If you are already viewing an overview page, and rewind time to a point where the SQL Server instance or machine was not yet being monitored, then the page contains no data. Try advancing the time forward to a point where the sparkline graphs are displayed.
This documentation contains proprietary information and is protected by copyright law.
Copyright © 2026 Red Gate Software Limited. All rights reserved


