Using performance diagnostics
Published 28 October 2013
Performance diagnostics help you investigate low-level problems with your instances and databases that may be affecting performance:
- Waits tell you how long SQL Server spent waiting to execute queries or other requests for resources or processes. Many waits occur as part of SQL Server's normal scheduling routine, but some can suggest underlying performance issues that are causing bottlenecks. The waits themselves might not tell you exactly what the problem is, but they can help you decide how to start troubleshooting.
- Queries can help you evaluate the efficiency of I/O usage, and identify problematic statements or execution plans.
The performance diagnostics feature is available on the Instance overview and Database overview pages. You can use it to:
- see the top waits and queries that occurred during the time period you're most interested in. See Changing the time period.
- see the ten most significant wait types in the Top 10 waits table, find out how long SQL Server spent waiting, and which queries were affected (Instance overview only). See Analyzing waits.
read detailed descriptions and expert troubleshooting advice for the most common waits. See Viewing wait documentation.
- see the ten most expensive queries in the Top 10 queries table, find out which used the most resource, how long they took to execute, and which waits had the greatest impact on the query. See Analyzing queries.
show the query statement and the batch from which it originated. See Viewing query details.
Changing the time period
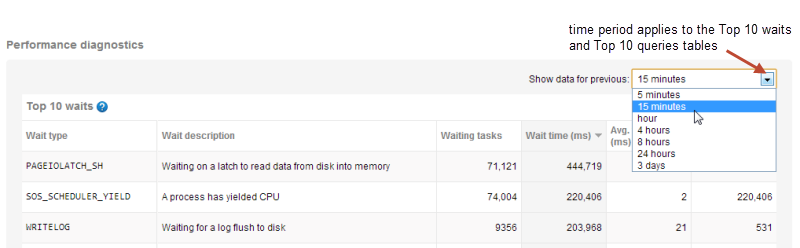
By default, the Top 10 waits and Top 10 queries tables show data for the previous 15 minutes. To change the time period, select an option from the drop-down menu:
You can also display data from a previous time period of your choice using the Back in Time control. For more details, see Rewinding time with Back in Time mode.
The time period selected for performance diagnostics data will also apply to the Back in Time setting. For example, if you 'rewind time' by one week and then select 3 days from the drop-down, you'll be looking at data collected between seven and ten days ago.
If data isn't available for the selected time period, it may have already been purged from the Data Repository. See Why is data missing?
Analyzing waits
The Top 10 waits table shows the waits that had the most significant impact on SQL Server for the selected time period. The data is read from the SQL Server DMV sys.dm_os_wait_stats and is updated automatically every 60 seconds.
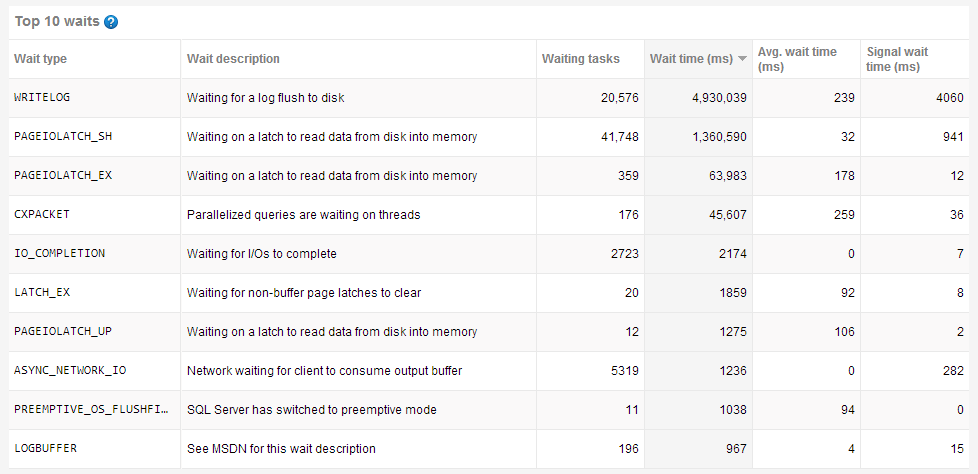
The table shows:
- Wait type - the name of the wait from the list of 600+ described in sys.dm_os_wait_stats (MSDN).
- Wait description - a short definition, so you know at a glance what SQL Server is waiting for.
- Waiting tasks - the total number of wait events.
- Wait time (ms) - the total time (in milliseconds) spent waiting for resource to become available. By default, waits are listed in descending order according to this metric.
- Avg. wait time - the total time (in milliseconds) spent waiting for resource, divided by the number of waiting tasks.
- Signal wait time - the total time (in milliseconds) spent waiting in a runnable state once SQL Server has signalled that resource is available.
To update the table manually, click on a column header containing numeric data. This generates a new table of queries based on that column; it doesn't just change the sort order of the waits you can see currently.
When you select a wait type:
- a list of the top 10 queries most affected by the wait is displayed. See Viewing affected queries.
- a description of the wait is displayed below the table. See Viewing wait documentation.
- automatic updates are paused. See Pausing data updates.
Viewing affected queries
Click on a wait type to show a list of the 10 queries most affected by the selected wait:
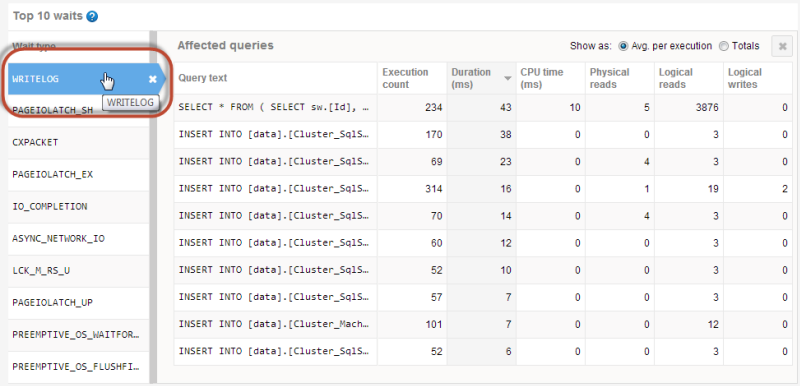
The table contents is almost identical to the Top 10 queries table; the only thing missing is the Database column. For more details, see Understanding the queries table.
Click on a query to show the query statement, the latest query plan handle, and a list of other waits that had the greatest impact on the query during execution. See Viewing query details.
Viewing wait documentation
Click on a wait type to show a detailed description of the selected wait below the Top 10 waits table:
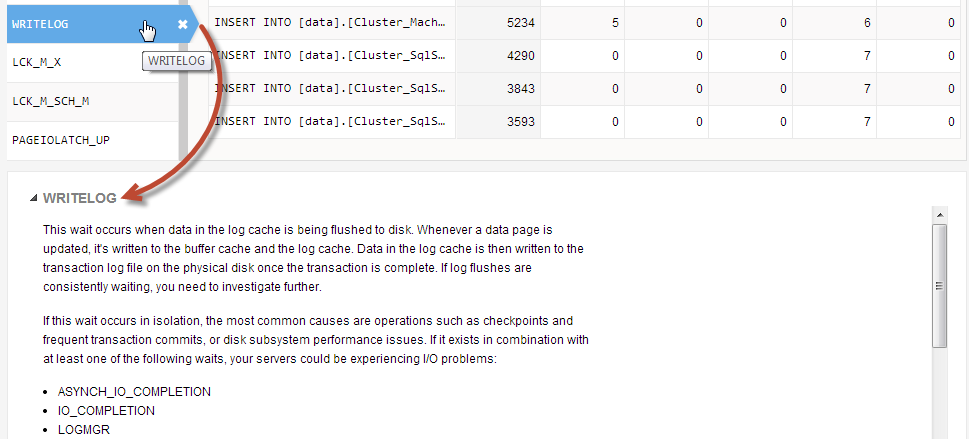
For the most common waits, you can see:
- details of why this wait occurred
- tips on how to start investigating, including links to expert articles, MSDN and TechNet resources.
For the remaining SQL Server waits, a link to MSDN documentation is provided.
Pausing data updates
Once you've selected a wait from the Top 10 waits table or a query from the Top 10 queries table, automatic data updates to the overview page are paused so the data won't change while you're analyzing it. The Back in Time control displays a message to confirm this:
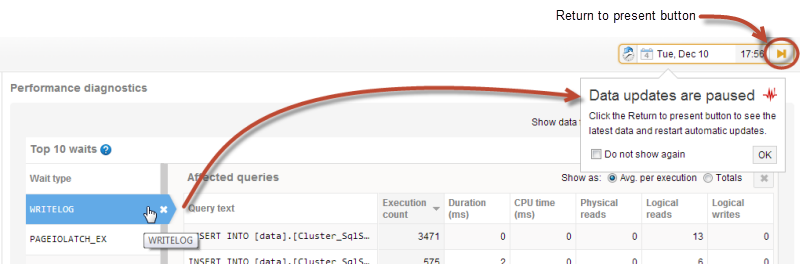
Data will remain frozen until you click the  Return to present button. For more details about the Back in Time control, see Rewinding time with Back in Time mode.
Analyzing queries
The Top 10 queries tables shows the queries that used the most resource during the selected time period. The data is updated automatically every 60 seconds.
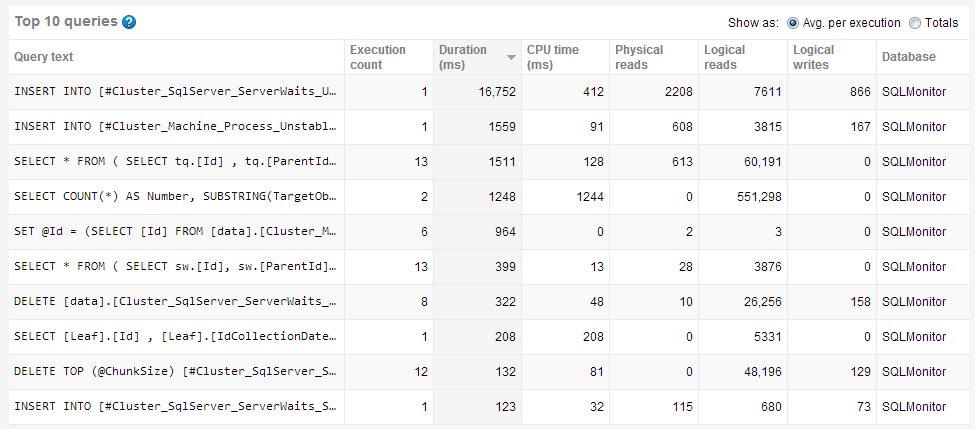
Understanding the queries table
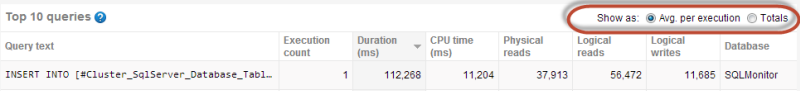
By default, Avg. per execution is selected; this lists queries based on average values over the time period selected. Click Totals to display queries based on total values:
The table shows:
- Execution count - number of times the query was executed.
- Duration - how long it took (in milliseconds) to execute the query. By default, queries are listed in descending order according to this metric.
- CPU time - how much processor time (in milliseconds) was used to execute the query.
- Physical reads - the number of times a page is read into the buffer cache. If the page is in the cache already, it uses the page already in memory and does not generate a physical read.
- Logical reads - the number of times the database engine requested a page from the buffer cache.
- Logical writes - the number of times data is modified in a page in memory. If a page stays in memory for an extended period, more than one logical write may be required before it is physically written to disk.
- Database - the database the query was run against.
To update the table manually, click on a column header containing numeric data. This generates a new table of queries based on that column; it doesn't just change the sort order of the queries you can see currently.
Selecting one of these options does not simply change the sort order of the existing list of queries. A new table is generated according to the selected option, so different queries are likely to be displayed.
Click on a query to show the query statement, the latest query plan handle, and a list of waits that had the greatest impact during query execution. See Viewing query details.
Viewing query details
Click on a query to show the Query details page:
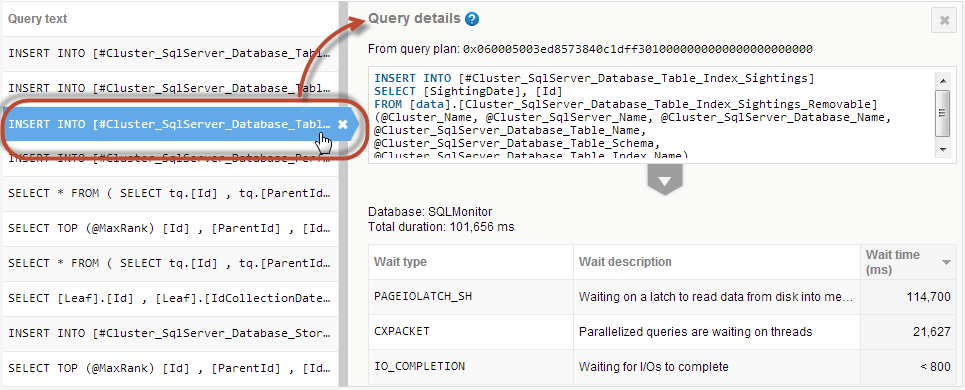
The page shows:
- the latest query plan handle.
- the full query statement.
- the name of the database against which the query was run.
- the total query duration.
This is equal to the query's average duration multiplied by execution count. The result can be less than the total wait time if the query was processed using multiple threads. This commonly occurs in environments with multiple CPUs, or those using parallel executions. - the waits that occurred during query execution. A maximum of three waits are displayed. Click on a wait to display further details below the Top 10 waits table. See Viewing wait documentation.
SQL Monitor samples the wait time data and returns an approximate value. Hover the mouse pointer over the wait time to display a tooltip containing the margin of error. For example: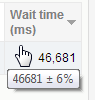
If the margin is between 20% and 40%, the value is preceded by a '~' tilde character: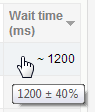
If the margin is between 40% and 100%, the value is preceded by a '<' less than character: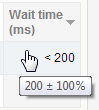
Expanding query details
Click on the ![]() arrow below the query statement. The top half of the page expands and the content changes:
arrow below the query statement. The top half of the page expands and the content changes:
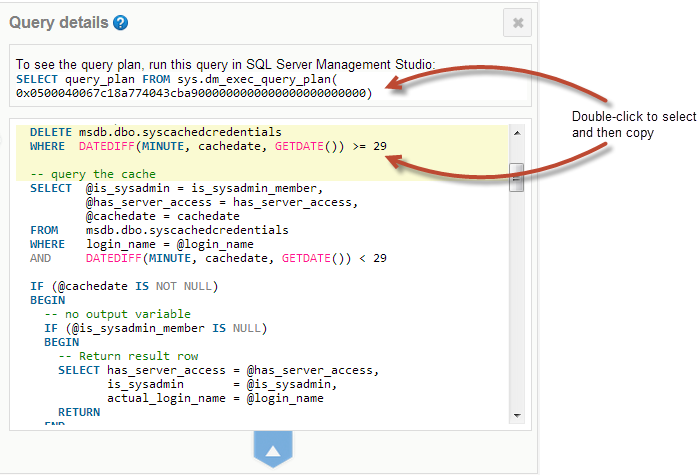
You can now see:
- the query plan as an executable SELECT statement.
Double-click to select and then copy the statement so you can execute it in SQL Server Management Studio (SSMS). The SSMS result shows a graphical execution plan, with icons representing statements and queries. For more details, see Displaying Graphical Execution Plans (TechNet). - an expanded query statement that includes the full contents of the batch from which it originates. The statement affected by the wait is highlighted in yellow.
Double-click to select and then copy the batch so you can execute it in SSMS.
Why is data missing?
Queries or waits may not be available for the selected time period for any of these reasons:
- there was no significant data to capture
- the data has been purged
- SQL Monitor wasn't running
- the database was unavailable or suspended
- SQL Monitor couldn't sample the data
This documentation contains proprietary information and is protected by copyright law.
Copyright © 2026 Red Gate Software Limited. All rights reserved


