SQL Server instance overview
Published 28 October 2013
The SQL Server instance overview lists all the databases hosted on the instance and shows the status of each. Databases are listed in alphabetical order, with system databases listed at the top of the page:
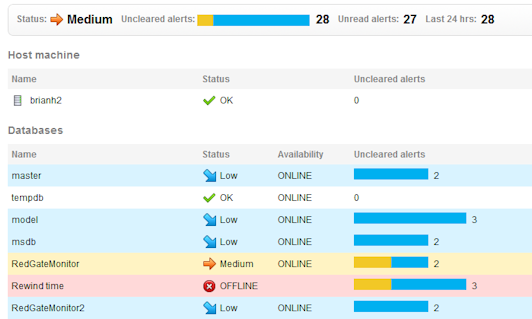
- Click in the Name or Status column for a database to drill down to the overview page for the selected database.
- Click on the colored alert bar for a database to go to the Alert Inbox for all uncleared alerts relating to that database
- Click on Uncleared alerts, Unread alerts or Last 24hrs in the alerts summary panel at the top of the page to go to the Alert Inbox for all alerts relating to this SQL Server instance (and all its databases)
It shows performance data for the last five minutes for a range of useful metrics. To go to the Analysis page for a metric, click on its sparkline graph.
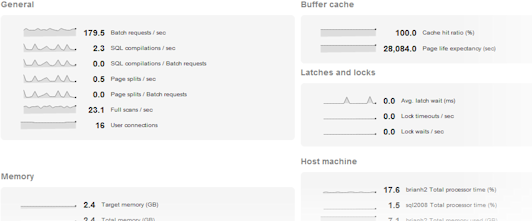
It also shows performance diagnostics featuring the top 10 waits and queries for the instance. See Using performance diagnostics.
Performance diagnostics are not available for servers running Microsoft SQL Server 2000.
This documentation contains proprietary information and is protected by copyright law.
Copyright © 2026 Red Gate Software Limited. All rights reserved


