Rewinding time with Back in Time mode
Published 08 March 2018
You can use the Rewind time control in SQL Monitor to enter Back in Time mode, so you can see the state of the data displayed on the overview pages at some time in the past.
You can also step forwards or backwards in time to see how the values on the overview page change. This helps you to investigate the performance of servers around the time a problem occurred. If you know the server or database where there was a performance issue in the past, you should first drill down from the Global Overview page to the relevant overview page.
The amount of previous data available to you depends on your data retention settings. See SQL Monitor data retention policy.
To enter Back in Time mode
The Rewind time control is displayed in the fixed header at the top of each overview page:
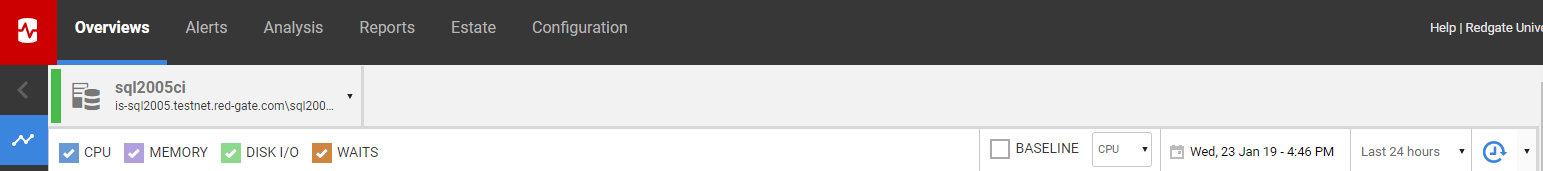
You can use the drop down to select the last 6, 12, or 24 hours, 2 days or 3 days. If you need to go further back in time to a previous day, week or month:
- Click the date /time
- The date picker is displayed with today's date selected:
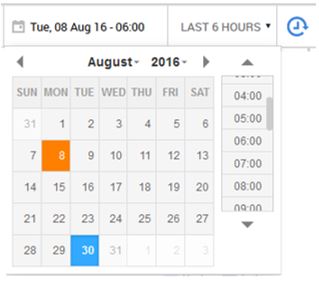
- Select the date, then select the time and type the hour and minute you want to rewind to (you can type directly over today’s date/time if needed). The page is refreshed to show a frozen snapshot of data for the date and time you specified.
- While you are in Back in Time mode, you can continue navigating through the overview pages as usual. The Focus Window will update the metrics to the selected period as before.
- To return to normal operation, click the
 Return to present button:

Data not available in Back in Time mode
Historical alert summary on the overview pages is not shown when in Back in Time mode:
- Un-cleared alerts will be shown but any cleared alerts will not be shown.
What happens when I go back in time before a server was added?
Servers added recently that were not being monitored at the time you are viewing are removed from the Monitored servers list.
If you are already viewing an overview page, and rewind time to a point where the SQL Server instance or machine was not yet being monitored, then the page contains no data. Try advancing the time forward to a point where the sparkline graphs are displayed.
This documentation contains proprietary information and is protected by copyright law.
Copyright © 2026 Red Gate Software Limited. All rights reserved


